Bee population has experienced a dramatic decline over the last decades as the data say, bringing the colonies of some states in particular to record lows. We aimed at targeting farmers who can take action to effectively help to restore bee populations to sustainable levels, by using interactive questionnaires where the farmer can input his answers. We want to tell this story because it can have a positive impact on farmers practices, leading to a recovery for the bee population and better farmers products through a more aware use of pesticides.
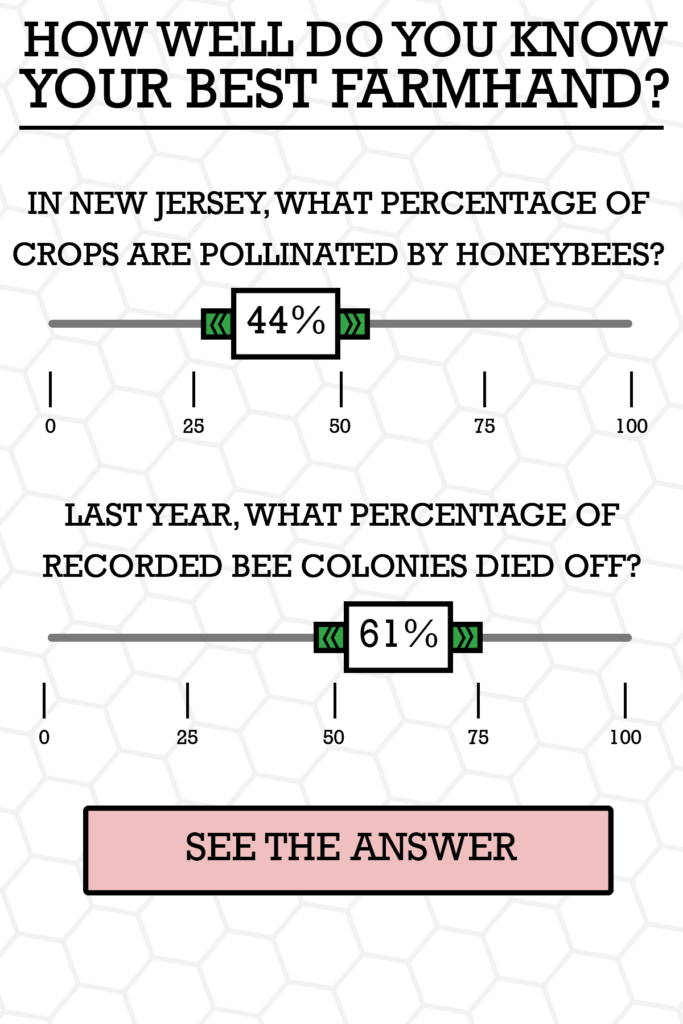
These questionnaires are placed as touch-screens (e.g. iPads) in stores for farmers supplies, ideally closer to the check-out, where shoppers can be drawn to them by the questions. These questions consist of insights about the bee population decline over time across their state, and the impact that different pesticides can have on them. After entering their answer, the true value is shown on the screen, hopefully having a shock factor on the farmer.
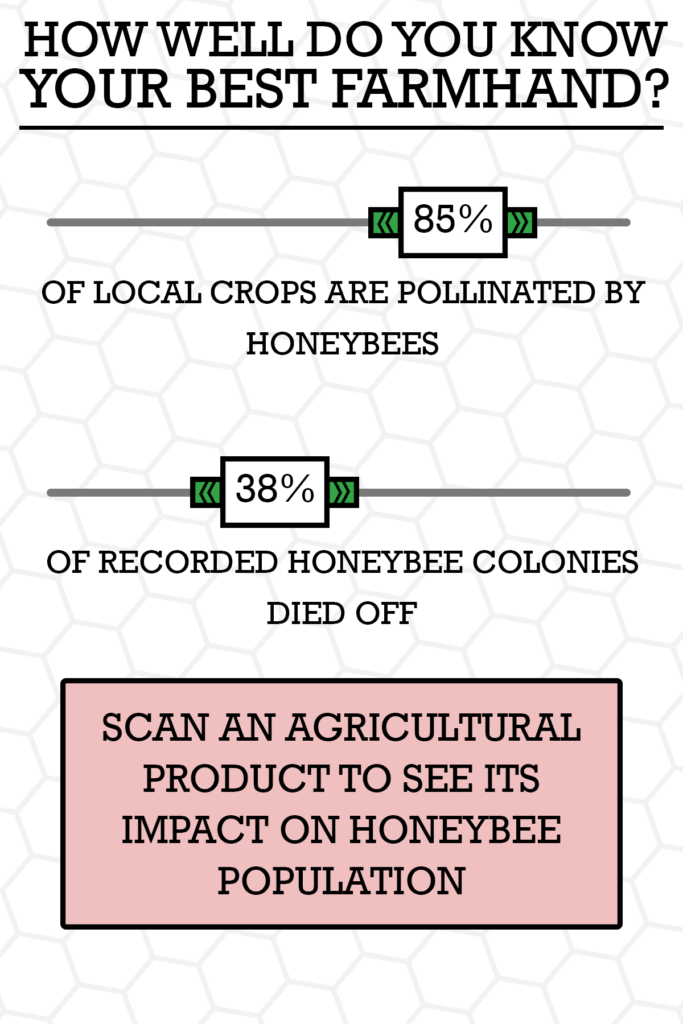
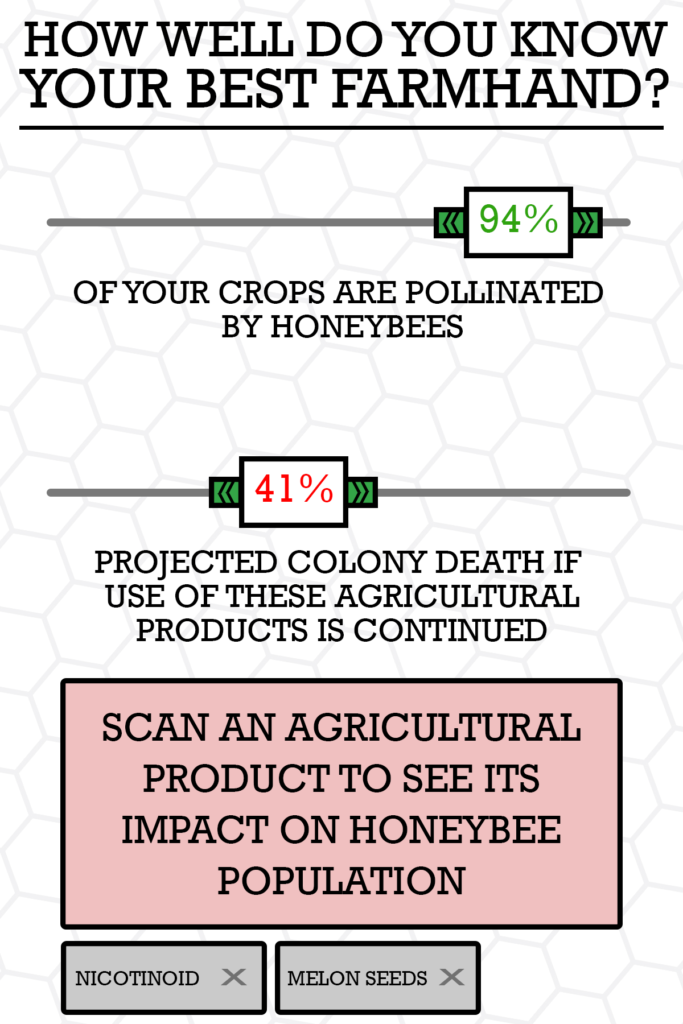
As an additional form of interactivity, the person can scan a pesticide that they are going to purchase, to see the impact that it would lead to the environment (e.g. the drop of bee population that was due to using that mix of chemicals, etc.). The farmer can then be recommended a different type of pesticide, showing a lower degree of harm to the bee population and foods.
To form the questionnaires, we used the bee population dataset, analysing the statistics of bee colonies, beekeepers and loss of population by state. This can more effectively help target states individually with statistics more relevant to each, and having a digital questionnaire makes having one per state relatively easy to do.
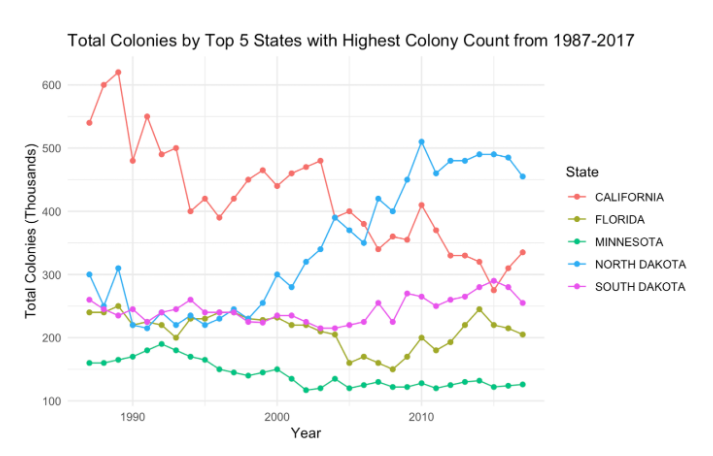
The Bee Colonie Statistics data from data.world say that since the 1990s, there’s been a drastic decrease in honey bee populations, and this trend has continued until today. While honey bees have seen increases in some states, in some states they have seen decreases. This story about bee colonies is very complicated to tell because there is no certain cause for these changes and states behave differently. Therefore, we focus on one state for the sketch: California who used to have an enormous number of bee colonies and has seen drastic decreases over the last couple of decades.
Figure 1: Total Colonies by Top 5 States with Highest Colony Count from 1987-2017
We want to tell this story of bees in California because we want people to take action against climate change. We chose K-5th Grade as our audience because it is important to inform the younger generation what will become a huge problem very soon. Our goals are to warn this young audience about what’s happening to the bees by putting themselves in the shoes of the bees through this game and to encourage them to understand their own role in contributing positively to creating bee-friendly ecologies. With the tool of empathy in this game, we want to create the urgence for their actions.
Data sources we used are the Bee Colony Survey Data by State, Bee Colony Statistics, data.world. We think that this game is an appropriate and effective way to tell the data story because it can be difficult to relate to bees sometimes and feel urged to take action immediately. With this game we put the kids in the shoes of the bees and make them realize the increase in deaths of bee colonies while playing the game. When we give them the option of taking an action or not, we’re showcasing that they can change the future of bees, therefore themselves. After probing their curiosity and stimulating their emotions, we immediately suggest possible actions they can take to save the lives of the bees in real life.
We hope that teachers will incorporate this game into their curriculum and actually take action with their students on a dedicated day at their school or go visit a beekeeper with their students.
Students register for the game with their name and choose a state where they want to play the game in.
We chose to use the state of California for the sketch purpose, but the next iteration of this sketch would incorporate all the available states in the dataset.
We also chose to use three levels in our sketch, but the number of levels can be extended for the next iteration.
We represent the bee colonie data by changing the ratio of bee to buildings in each level.
Level 1: Player bee is in California in 1989 where there are 62,000 bee colonies.
[While switching to a new level, we state facts about the changes in the data.]
“In the last 25 years, HALF of your friends and their families died because of climate change. We are sorry for your loss.”
Level 2: Player bee is in 2016 where there are 31,000 bee colonies in California.
At the end of Level 2, we again give facts about the predicted changes in the data and ask the player whether they will take action or not.
“Without climate action, we estimate that you will be losing another half of your friends and their families in the next 25 years. Maybe you’ll be amongst those. Will you take action to save the lives of your friends and your family? Will you take action to save the bees?”
We ask them to choose one of these options:
A. Yes, I will take action. → Level 3A: 2040. Bee colonies numbers rose again and there are plenty of homes for the bees.
B. No, I won’t take action. → Level 3B: 2040. Bee lost another half of their friends and their families in the next 25 years.
At the end of the game, we encourage the player to take action by explaining what they can to take action and save the bees.
1 in every 3 bites of food is made possible by bees and other pollinators. Sadly, in 2017-2018, the US lost over 40% of managed beehives. To save the lives of your bee friends, you can take this action.
Everyone can make a positive impact to help bees and the environment. Feel the power of individual action! Learn what you can do to change the world – one bee and student at a time!
PLANT FOR POLLINATORS
Planting a pollinator garden helps honeybees immensely. Bees rely on the nectar and pollen from nearby flowers for their survival; when flowers are scarce, bees can starve. By planting a pollinator garden, you’re ensuring that bees have a source of food year round — just be sure your garden is pesticide free.
Want to learn which plants are right for your planting zone, or how to get organic seeds? Check out our Pollinator Gardenresource page.
GO PESTICIDE FREE
Pesticides are harmful to humans and worse for bees. The chemicals and pest control treatments used on lawns and gardens weaken bees, and are especially damaging if applied to flowers in full bloom. Research shows that neonicotinoid pesticides linger in the nectar and pollen of flowers, where bees are most likely to come into contact with them. These treatments weaken bee immune systems and make them more susceptible to disease and infestation by pests. For resources on bee-friendly means of pest control, read our Natural Pest Controlguide.
SWARM? NO PROBLEM
Swarming is a natural process that occurs when colonies of honey bees have outgrown their hive. If you see a swarm, contact a beekeeper’s association; many bee-conscious groups will collect swarms to keep or relocate them to a safer new home. Honeybees in a swarm are very gentle and present very little danger, but can be made aggressive if disturbed or sprayed with water. Just leave them alone and wait for help to arrive.
BE PART OF THE SOLUTION
Ecologists and researchers interested in honeybees have started reaching out to citizens for help in huge research projects. You can provide vital information to these projects, all of which add to our knowledge of what we can do to help the struggling honey bee. Check them out and get involved!
Planet Bee’s ZomBee Watch Project– A brand-new Citizen Science lesson created by Planet Bee and created in collaboration with Professor John Hafernik’s ZomBee Watch program. This 3-day lesson involves the construction of light traps in order to catch and examine “ZomBees”, or bees which have been parasitized by zombie flies.
The Great Sunflower Project – The world’s largest citizen science project, aimed at gaining a better understanding of pollinators and their conservation.
NASA Honeybee Net Study – investigates the relationship between plant and animal life cycles by measuring the weight of honeybee hives throughout the year.
A study on the differential effects of selected climate factors on French wine grape harvesting
VIDEO: https://youtu.be/qVcJgMXCHdA
We have chosen to work with the dataset of grape harvest dates (GHD) series that has been compiled from international, French and Spanish literature and from unpublished documentary sources from public organizations and from wine-growers: https://www.ncdc.noaa.gov/paleo-search/study/13194
That specific piece was inspired by a study published at the journal Nature (Climate change decouples drought from early wine grape harvests in France) in March 21, 2016: https://www.nature.com/articles/nclimate2960
With our key references at mind (others are listed over this blogpost), we then discussed narrative and audience, making the following decisions:
Idea: Geographically visualize the differential effects of climate factors on grape harvest dates
Audience: amateur French wine club members in the US
Although Climate Change is an important topic concerning a broad audience, we want to focus on a specific group for effective communication.
Limited to French wine because of our analysis
Limited to US because presentation is in English
Narrative: effect of climate change on French grape harvest dates
Climate observations: Climatic Research Unit (CRU) Time-Series (TS) of High Resolution Gridded Data of Month-by-month Variation in Climate (Jan. 1901- Dec. 2012)
Part 1: Exploring Correlations Between Selected Climate Factors and GHDFigure 1. Grape Harvest Date versus climate observations (temperature, precipitation and PDSI(Palmer Drought Severity Index)) demonstrating correlation between GHD and climate.
Observed high and significant correlations between GHD (Grape Harvest Date) and temperature. (High R^2 and low p-value, i.e. R^2=0.704, p<0.0001). The linear relationship is negative, i.e. As temperature increases, the harvest dates start becoming earlier.
Observed high and significant correlations between GHD (Grape Harvest Date) and precipitation. (High R^2 and low p-value, i.e. R^2=0.241, p<0.0001) between 1901 and 1980 but low and insignificant correlations between 1981 and 2007. The linear relationship is positive, i.e. As precipitation increases, the harvest dates start becoming later. While this relationship was true in the early-mid20th century, it has not been as pronounced in recent years.
Observed high and significant correlations between GHD (Grape Harvest Date) and PDSI. (High R^2 and low p-value, i.e. R^2=0.241, p<0.0001) between 1901 and 1980 but low and insignificant correlations between 1981 and 2007. The linear relationship is positive, i.e. As PDSI increases, the harvest dates start becoming later. While this relationship was true in the early-mid 20th century, it has not been as pronounced in recent years.
Because the clearest correlation is between temperature and GHD, we chose to use the temperature in our data story.
Part 2: Multi-regression model:
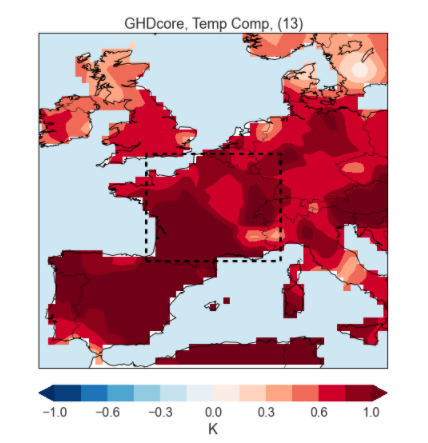
Part 3: Plotting temperature correlations on the map
Figure 2: Grape Harvest Date – Temperature correlation (1900-1980)
Figure 3: Grape Harvest Date – Temperature correlation (1981-2007)
Conclusion:
The data analysis shows that the warmer temperatures, characteristic of the Climatic Change caused by anthropogenic interference, have been a consistent factor of early harvests and high quality wines in France. The data also indicate a fundamental change in the role of the availability of droughts and humidity as large-scale factors in the timing of the harvest and the quality of wine in France and Switzerland, as demonstrated by the scientific article published in Nature. However, in our maps, we decided to focus on the correlation between harvesting and temperature.
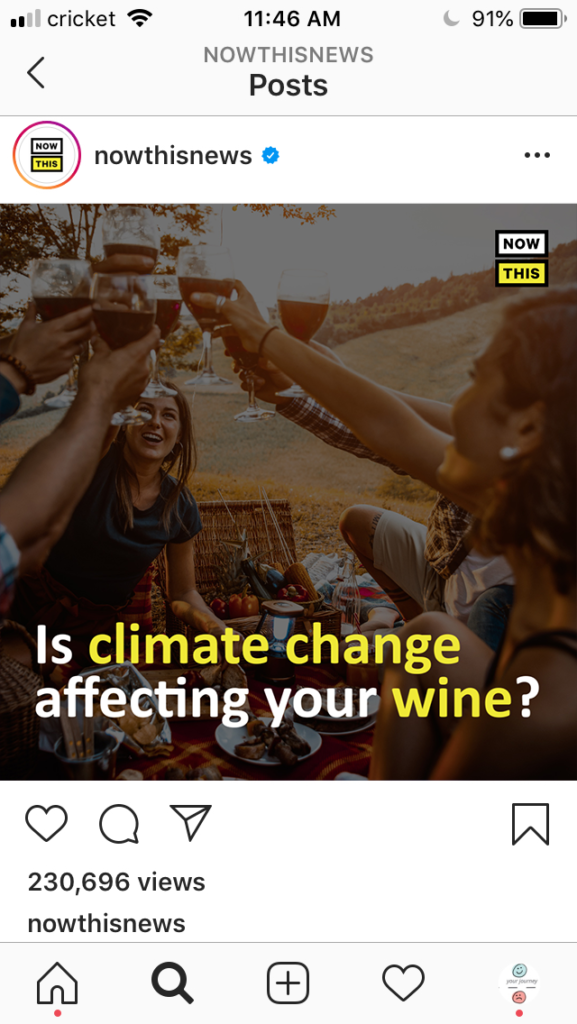
Our data story is a video inspired by accounts like @nowthisnews on Instagram. Our goal with this video is to communicate the impacts of climate change with the changing taste of wine around the world. The decision to create an Instagram post was meant to reach our target audience of millennials, who are now the generation that consumers the most wine worldwide.
The data says that Old World wine-producing countries in Europe are experiencing shorter wine harvesting seasons. The seasons are shortening due to climate change and increasing temperatures globally. We want to tell this story because it demonstrates how the goods we consume regularly are changing both in how they are made and how they taste.
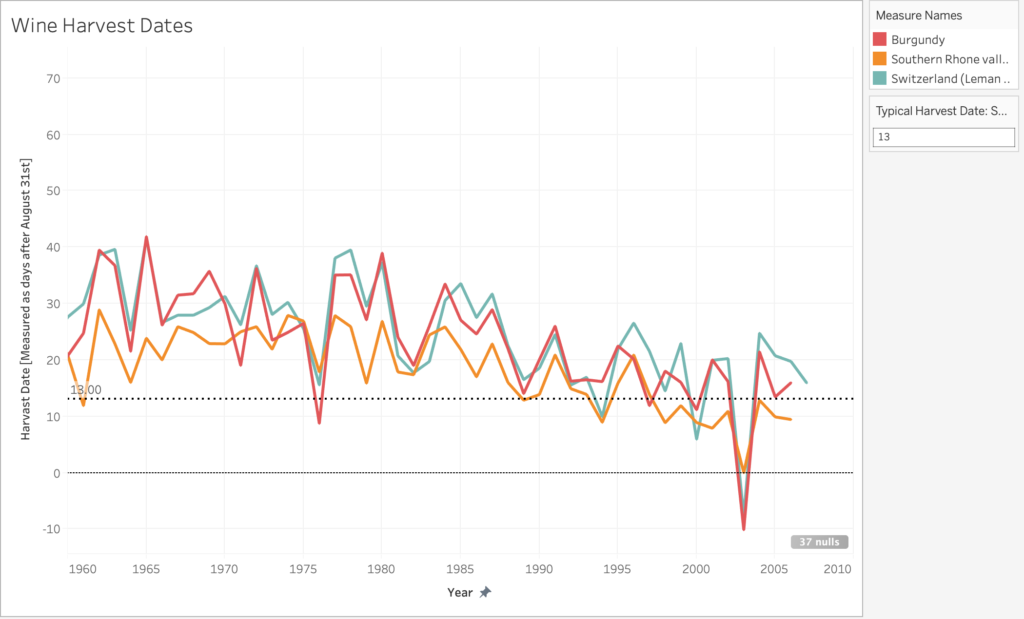
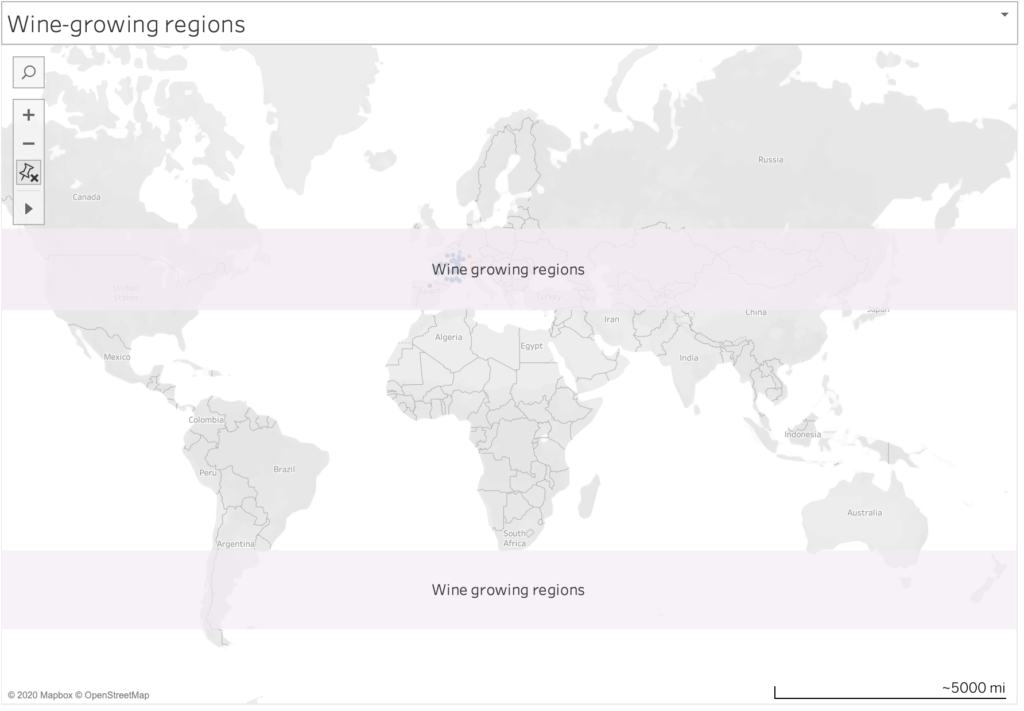
We use the 700 years of grape harvest dataset for this data story. The dataset shows the harvest date (counting from August 31st) of every year starting in the 1500s. We decided to focus on the regions with the most data. We then decided to the data from 1960-2007 to clearly illustrate the impact that climate change has had on growing seasons.
Traditionally grapes for wine have grown in regions between 30-50 degrees latitude in the northern and southern hemispheres. As temperature rises, the ideal conditions for growing grapes move further towards the poles into higher altitudes. For regions that are experiencing higher temperatures harvest times are shorter and the alcohol content is higher in grapes. In response, growers are changing the types of grapes they grow to more resilient strains and sometimes to different types of wine altogether. All of these factors will impact the kinds of wine we drink and the way that they taste.
Things we could expand on in the future:
Add dataset that shows the new growing regions and explain why they are now suitable for growing (ie, locations at a high altitude and lower latitude, or lower altitude at a higher latitude)
Download Tableau map layer for latitude and longitude gridlines
Comparing the volume of wine produced by certain grapes as growers shift to more
Comparing the volume produced by different regions over time
We chose to work with historical tropical cyclone data from NOAA and mapped the cyclone’s paths, finding that this helps convey the amount and accumulating effects of cyclones. We wanted to tell this story because cyclones can be devastating and we wanted to draw attention to their effects and the solutions for reducing their impact.
We presented ourselves as representatives of the island nation of Vanuatu, making the case for increased international aid so that they can make their building more cyclone resilient. We first narrowed in our focus to the South Pacific region after researching cyclone impact. This region is at the frontline of climate change — the Pacific islands are some of the lowest carbon emitters in the world, and yet some of the most impacted by the effects of carbon emissions. For them, climate change isn’t just a matter of moving further inland or adding a barrier, but preserving their existence. We also found in our initial background research that climate change will increase the frequency of severe cyclones, which means higher wind speeds and more destruction.
We further decided to highlight the Cyclone Pam occurring in 2015 and Vanuatu, because like many of the Pacific Islands, Vanuatu isn’t just hit by a cyclone, it’s often engulfed by it. Pam was also a well documented story, both in terms of information from NOAA as well as images and articles that were written at the time. There was also some discussion over how to rebuild Vanuatu, both in the World Bank paper and in an article from the Conversation about the best ways to go about doing this. The Conversation article is especially worth a read, looking at how to balance resilient building features with traditional housing structures, so that buildings can be made safer without trampling over culture. These resources are linked in our references section.
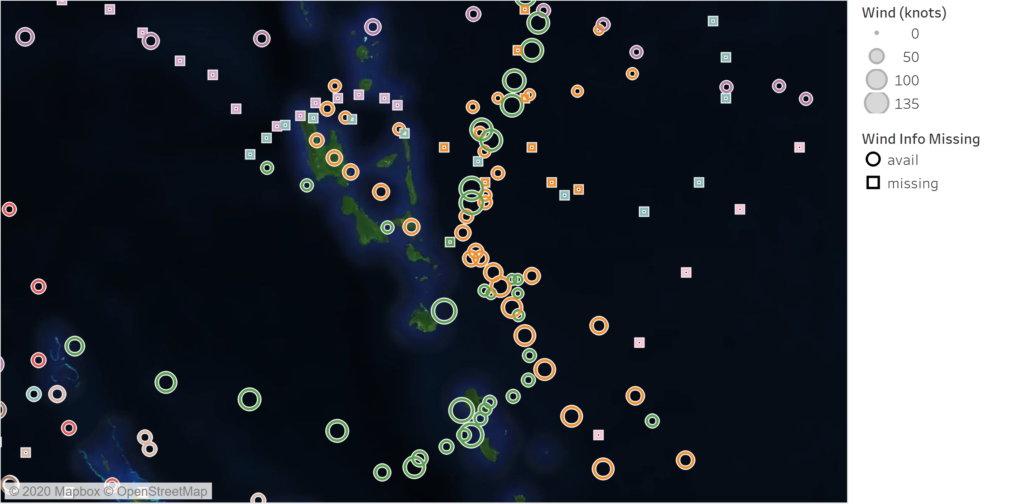
paths of cyclones in South Pacific Basin from 2010-2015 (screenshot of animation) paths of cyclones around Vanuatu from 2010-2015 (screenshot of animation)
We mapped the cyclone paths in Tableau, creating an animation showing the accumulation of cyclones in the South Pacific cyclone basin region over the period of 2010 to 2015, to show that these cyclones are not one offs and that this region is particularly prone to the effects of cyclones. We used windspeed as a measure of cyclone severity, plotting bigger circles for higher recorded windspeeds. While the most recent cyclones had more complete windspeed data than the earliest ones in the mid-1800s, most of the cyclones still did not have data for every record in their paths. We used a different shape to represent that there was a record of the cyclone’s position but not its windspeed to delineate missing data. In our presentation, we included an inset showing Vanuatu, because this was the focus of our presentation and we wanted to contrast the size of the island with the repeated impact of the tropical cyclones.
We chose to do a powerpoint presentation because this was a likely format that representatives of the Pacific Islands would use to ask for aid. It also forced us to tell this story in two slides and in a quick 3 minutes, which is typically how much time an aid group might get in their pitch to a global recovery fund. It made us really cognizant of what information went in and what was left out.