Data Story Telling Studio Sketch #3: “Air Filters”

Group: Joshua Feldman, Samra Lakew, Neil PendseAir Quality Dataset: https://aqicn.org/here/

For our sketch, we imagined we were members of GreenPeace trying to develop a campaign to build support for an international air pollution treaty. Our intended audience is under 40 because they will have to live with the effects of poor air quality. This campaign is part of a larger strategy at GreenPeace to engage gen Z in the fight for a greener earth. To generate as much support as possible, we knew our campaign needed to fulfill a few criteria. It had to be:

  1. Understood quickly
  2. Simple for our audience to sign the petition
  3. Shared easily
  4. Engaging


Since our audience was comfortable with social media and video calls, to meet these criteria we designed a series of video filters that can be used on platforms like Snapchat, Zoom, and FaceTime. The filter illustrates the current air quality in a user’s location and has a link to the petition where users can also share the campaign with friends. We show the air quality in two ways. At the top of the screen, we have a bar which fills up as the air pollution gets worse and changes from green to yellow to red. Above the bar, we show the user their current location so they know that this is specific to them.

Additionally, the filters make the pollution in the air visible. As the air pollution in a region gets worse, an increasing number of icons will float around the user and obscure them. We also cover the user with a smog-like haze, which gets thicker and more red when the air is more polluted. 

At the bottom of the screen, we have a button that links to the online petition and users can share the campaign from there. When they sign the petition, they can also sign up for future GreenPeace communications.

When users click on the screen, they can change the icons. When users first turn on the filter, the text “tap on the screen to change the icons” will appear on the screen, so users know about the feature and are immediately pulled into the story.
We also wanted the campaign to be timely. Isolation measures due to the COVID-19 pandemic have improved air quality around the world. Users can see this effect by scrolling back and forwards through time and see how air quality has changed since a shelter-in-place order was put in place in their location.

As the user scrolls back in time, they can see the air quality get worse. There are more icons on the screen and the smog is thicker and more red.

When the user scrolls forward in time, they are able to see the effect of the action they’re taking. Instead of showing a date, we tell the user that this is “tomorrow, if they take action today”. The smog disappears, the PM measure drops down, and the icons change to green jewels.

We feel like this filter meets our 4 original criteria. We hope that users will very quickly be able to see the pollution in the air around them and understand that something needs to be done. To emphasize this point, we tried to communicate the air quality in many different ways: through symbols like the bar, through text, and through video via the filter. 

To make it easy for users to sign the petition, we tried to feature the button prominently and make it link directly to the petition.

We want users to share this campaign broadly. To achieve this goal, we chose a digital medium because sending a link is easier than sharing a physical object.

Finally, to make the campaign engaging, we used a number of techniques to make the user feel part of the story. The video filter literally puts them into data. We also have opportunities for the user to engage with the campaign by tapping to change the icons and scrolling back and forward through time. We also wanted to make a serious topic seem more approachable by taking a more playful approach. We made air pollution seem gross, not dangerous, and the clean air screen looks like the user just won a video game. Hopefully, by seeing themselves in the data story, engaging with the campaign, and feeling like the issue is approachable, users will pay more attention to our message and be more willing to take action.
How climate change is impacting Millenial winos

Team: Olivia Yue, Samra Lakew

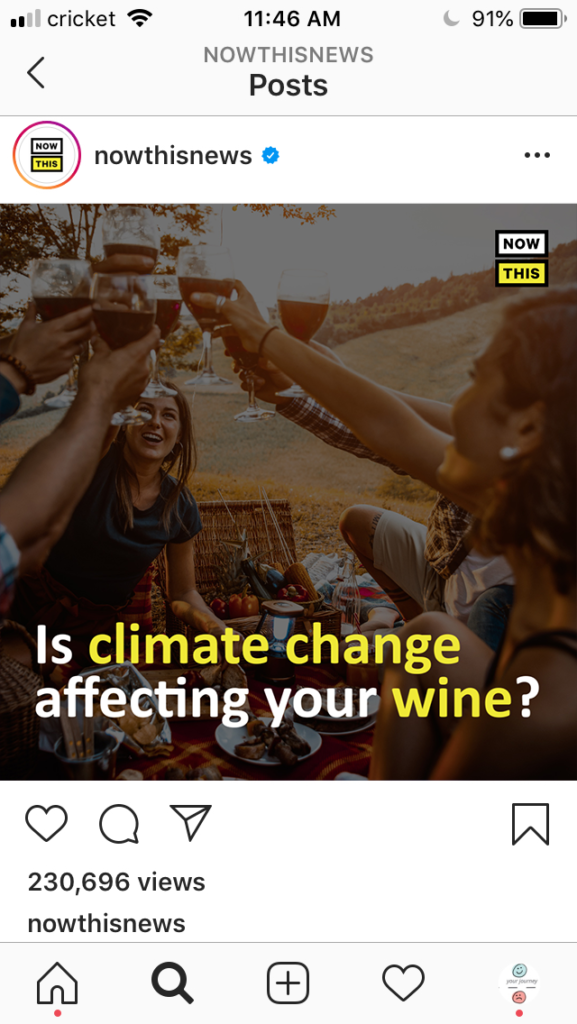
Our data story is a video inspired by accounts like @nowthisnews on Instagram. Our goal with this video is to communicate the impacts of climate change with the changing taste of wine around the world. The decision to create an Instagram post was meant to reach our target audience of millennials, who are now the generation that consumers the most wine worldwide.

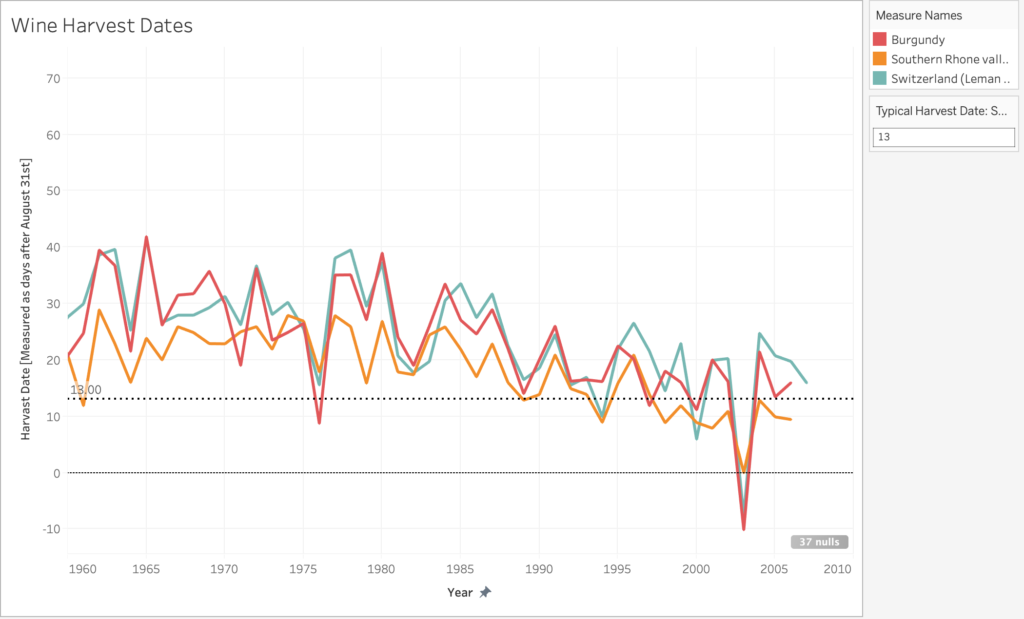
The data says that Old World wine-producing countries in Europe are experiencing shorter wine harvesting seasons. The seasons are shortening due to climate change and increasing temperatures globally. We want to tell this story because it demonstrates how the goods we consume regularly are changing both in how they are made and how they taste.

We use the 700 years of grape harvest dataset for this data story. The dataset shows the harvest date (counting from August 31st) of every year starting in the 1500s. We decided to focus on the regions with the most data. We then decided to the data from 1960-2007 to clearly illustrate the impact that climate change has had on growing seasons.

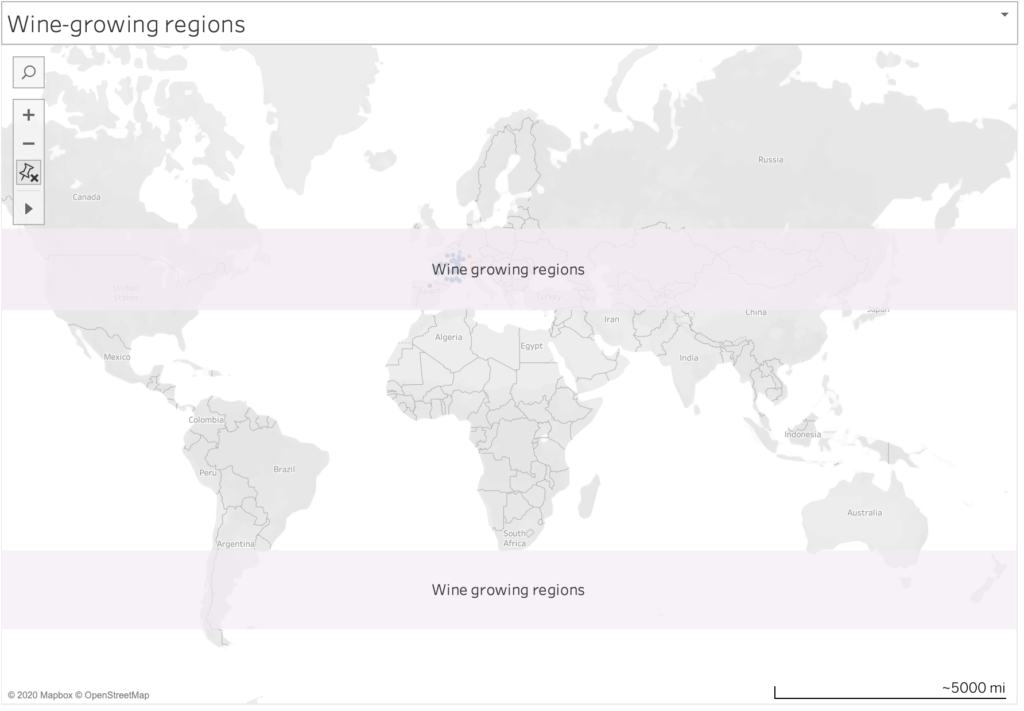
Traditionally grapes for wine have grown in regions between 30-50 degrees latitude in the northern and southern hemispheres. As temperature rises, the ideal conditions for growing grapes move further towards the poles into higher altitudes. For regions that are experiencing higher temperatures harvest times are shorter and the alcohol content is higher in grapes. In response, growers are changing the types of grapes they grow to more resilient strains and sometimes to different types of wine altogether. All of these factors will impact the kinds of wine we drink and the way that they taste.

Things we could expand on in the future:

  • Add dataset that shows the new growing regions and explain why they are now suitable for growing (ie, locations at a high altitude and lower latitude, or lower altitude at a higher latitude)
  • Download Tableau map layer for latitude and longitude gridlines
  • Comparing the volume of wine produced by certain grapes as growers shift to more
  • Comparing the volume produced by different regions over time

Sources:

https://www.ncdc.noaa.gov/paleo-search/study/13194

https://www.washingtonpost.com/business/2020/01/31/wine-climate-change-/

https://www.nationalgeographic.com/science/2019/09/wine-harvest-dates-earlier-climate-change/#close

https://blog.mineral.agency/the-millennial-wine-consumer-72d2e53947f7?gi=d947021ff607

Climate Change 4 Kids

Team Members: Sam Ihns, Samra Lakew, Robert Vunabandi

sketch slides

The data says that the United States is the country with the highest CO2 emissions per capita in the world. We want to tell this story because today’s children will be the group most impacted by the effects of climate change and should be able to advocate for themselves.

This sketch was designed for an intended audience of junior high students. We decided to focus on junior high school students because they are far enough in their educational journey to have been exposed to charts and different types of data visualization. At this age, they are also familiar with the concept of climate change but are still young enough to be forming their own opinions about the subject. Our aim was to use the World Bank global CO2 emissions data to contextualize the issue of carbon emissions in a way that provides children with enough information to empower them to learn more and take action but not so much that they feel overwhelmed or scared.

Inspired by this recent and popular comic explaining coronavirus to children, we chose to use a comic-strip inspired format for this piece.

Future improvements

In the next iteration of this sketch, there are a number of improvements we could make to build a richer, more compelling story that would effectively meet the goal of educating and empower kids to take on the issues of climate change.

  • Add suggestions on where the kids can go to learn more
  • Provide examples of other children who are making a difference in this space, including Greta Thunberg, Leah Namugerwa, and Autumn Peltier.
  • Share ideas for how kids can reduce their family, school, or community carbon footprint.

Samra’s Data Log 02/23

Chatting with people

Texting via iMessage, Whatsapp, GroupMe

Social Media scrolling and sending posts to friends via Instagram and Twitter — I have limited myself to 1hour/day on these apps

Video chatting via, FaceTime and Whatsapp

Moving around town

I used ridesharing services a total of 4 times yesterday! This is abnormal as I usually take the T or the EZ Ride bus to get around.

Accessing student lounge with student ID

Getting online

I definitely go down the YouTube rabbit hole, watching videos on nutrition, daytime talk shows, and celebrity gossip

I spend a lot of time researching products before I buy them. On this day I researched moisturizers and smoothie “boosters”

I created a month-long workout program and looked up existing exercises for inspiration and copied workout pictures to remind myself of the moves while at the gym.

Other things

I try to purchase most things on my credit card so that I can accumulate points.

Yesterday, I bought brunch for 5 people and Venmo requested those same 5 people

Listening to my audiobook (on the public library app) and to 3 podcasts on the Podcast app.

Presidential Approval and War

Source: https://www.theguardian.com/news/datablog/2020/jan/04/trump-iran-suleimani-president-approval-ratings

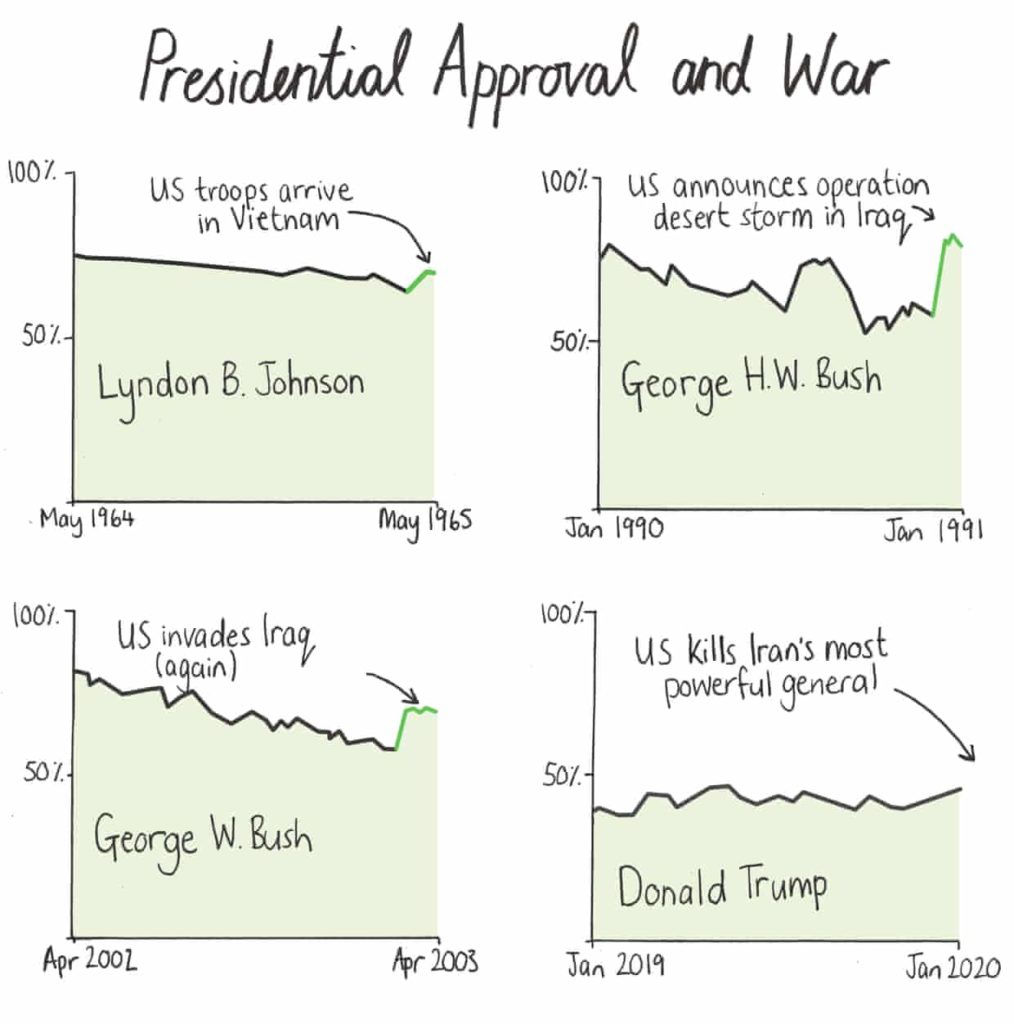
The above graphic includes four, line charts that show U.S. presidential approval ratings during their time in office. The first three charts are of former U.S. Presidents, Johnson, H.W. Bush, and W. Bush. All three charts show a sharp uptick in approval ratings immediately following an act of war between the U.S. and another country. The fourth chart shows the current approval ratings for Donald Trump and the U.S. recent attack Irans highest military official is noted on the x-axis without any data after that moment.

The audience here is anyone concerned with U.S. politics. Given that the article is written for the Guardian, it likely that a liberal person or a moderate conservative would be interested in this information. It’s less likely that this graphic would sway someone who is supportive of this administration and so I would not include them as part of the intended audience.

By juxtaposing information from three similar, historical situations the graphic speculates that the U.S. actions in Iran are motivated by President Trump’s low approval ratings. However, it does not explicitly say this. The graphic serves two purposes: validating the beliefs of someone who is already critical of the current administration and providing food-for-thought for a moderate or independent voter.

I think this method of conveying information is effective because the article does not tell the reader what to think but instead provides a small puzzle for the reader to solve. Solving the puzzle, allows the reader to come to their own conclusion. This is a powerful tool because people are generally more inclined to believe something that they think they came up with themselves — despite the fact that there is only one conclusion that you can arrive at with the information available in the graphic. The current political climate is such that discussions are often heated between opposing viewpoints and little is actually heard. This method of conveying information is less combative and assumes the reader’s intelligence.