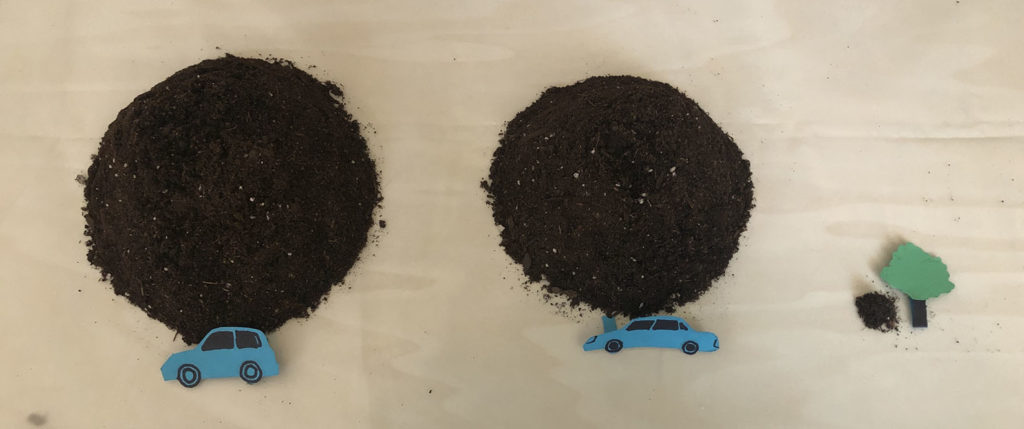
This is a representation of yearly CO2 emission per year by SUV’s vs midsize cars, the 2 piles of soil are used to represent the weight of CO2 produced per year, the pile next to the tree represents the CO2 absorbed by a tree per year.
Gardening soil is
used to represent CO2 emissions because of its resemblance partly because of
its imagery of pollution and partly due to availability. Piles pf soil are made
to look significantly bigger than the cars to emphasis the emission quantities.
Calculations:
Average CO2 emission for SUV’s per year: 5933kg
Average CO2 emission
for midsize cars per year: 4243kg
Difference: 1690kg
Typical CO2 amount
absorbed by a tree: 22kg
Equivalent number of
tree for the difference in CO2 emission: 77
Driving a midsize car instead of an SUV is equivalent to saving 77 trees, in terms of CO2 emissions.
I sketched out a data sculpture idea using the NYC street tree data that I worked with in sketch 1 (https://datastudio2020.datatherapy.org/2020/03/05/trees-in-nyc-sign-up-to-help/)
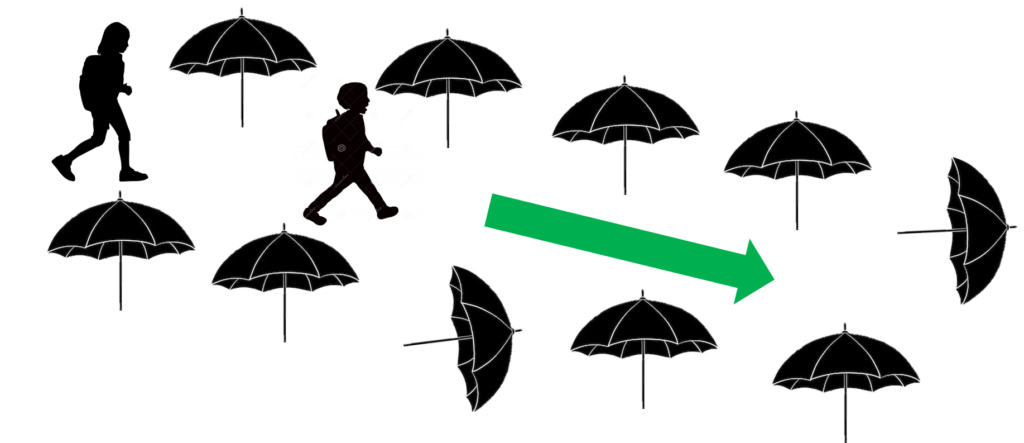
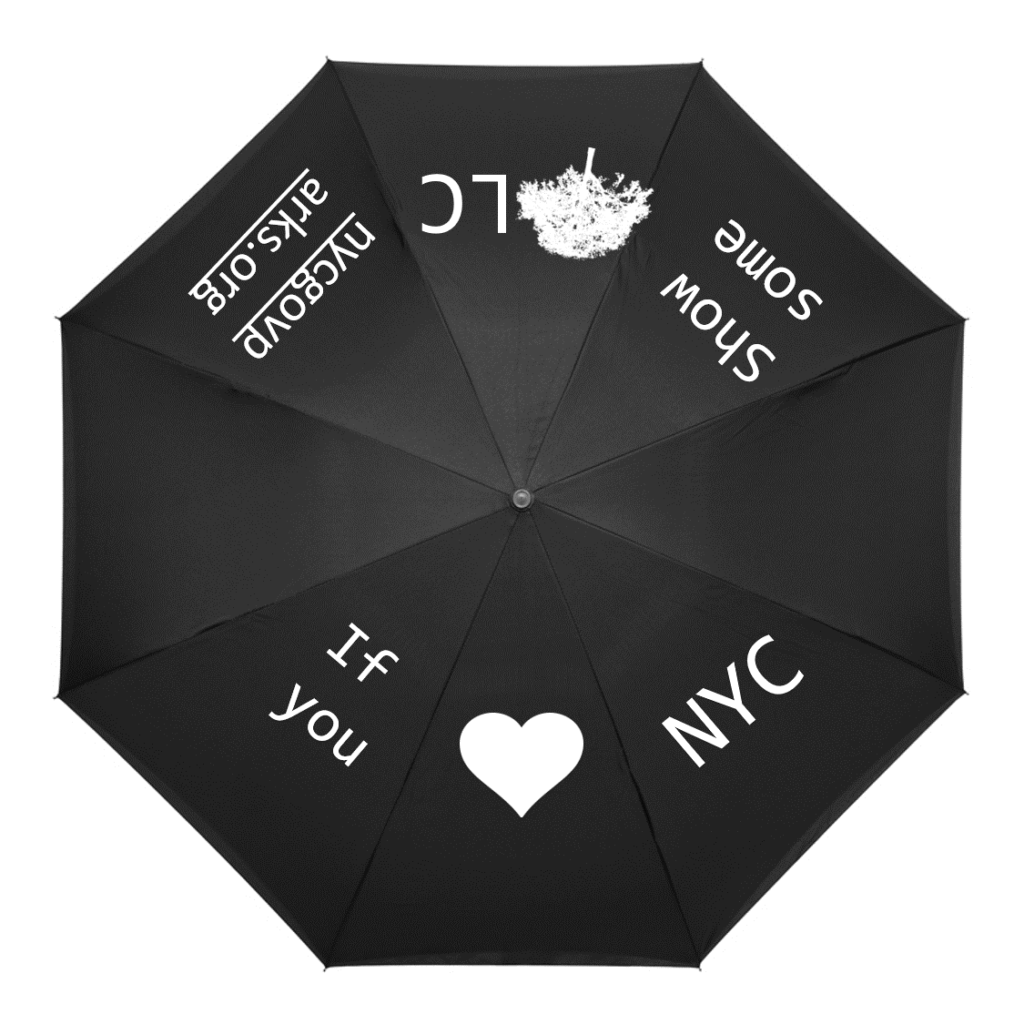
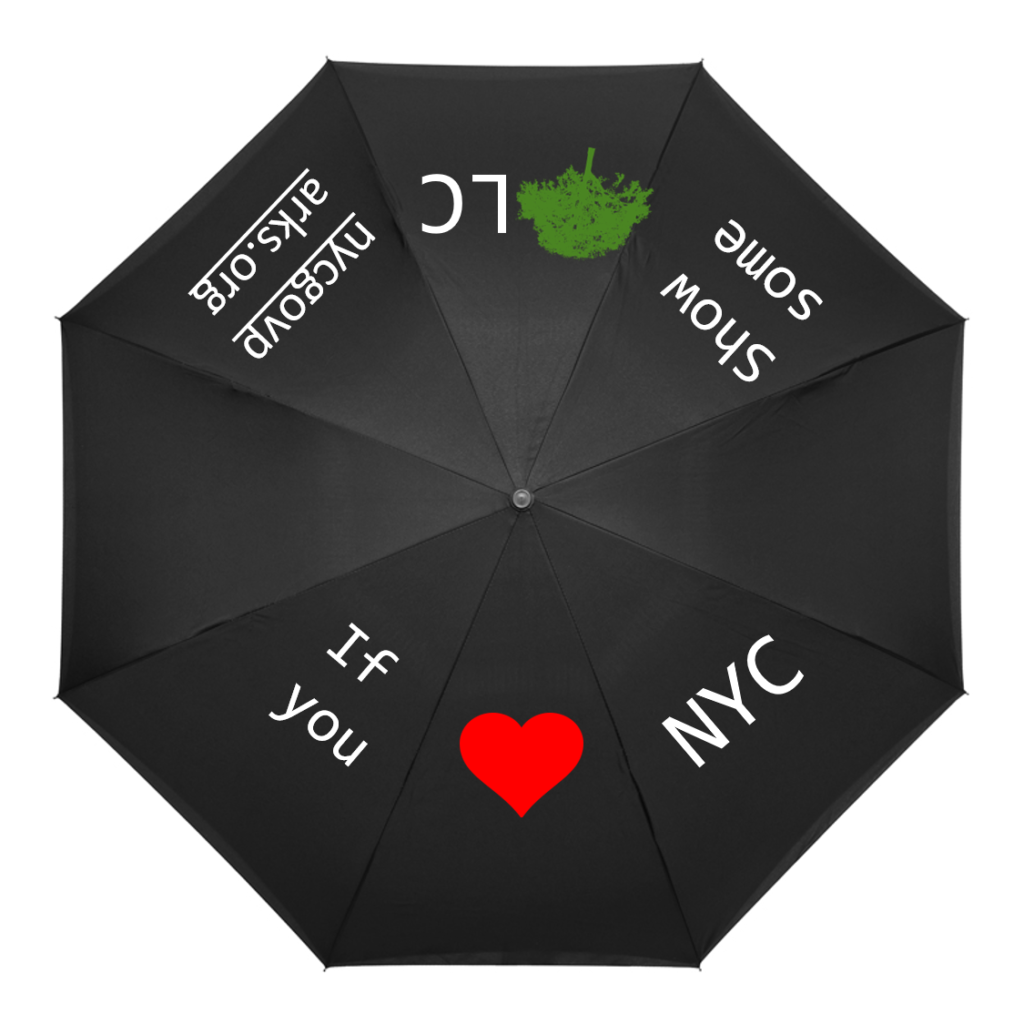
This sculpture would be an installation in Central Park near a playground so it would get traffic from kids. The sculpture would have umbrellas “planted” in the ground, creating a “street” lined with the umbrellas that people could walk down. This connects to the idea that street trees provide shelter and protect the urban environment around them. Originally I was going to mock up what one of the umbrellas would look like with colored paper cutouts, but I realized that the umbrellas in my house are mostly patterned and might be hard to set up in a standing position. Instead, I’m sharing some illustrations that hopefully are enough to convey the concept!
One out of five umbrellas would be knocked over, to represent the one in five street trees in the NY Street Tree Census that were shown to be not in good health (fair or poor health).
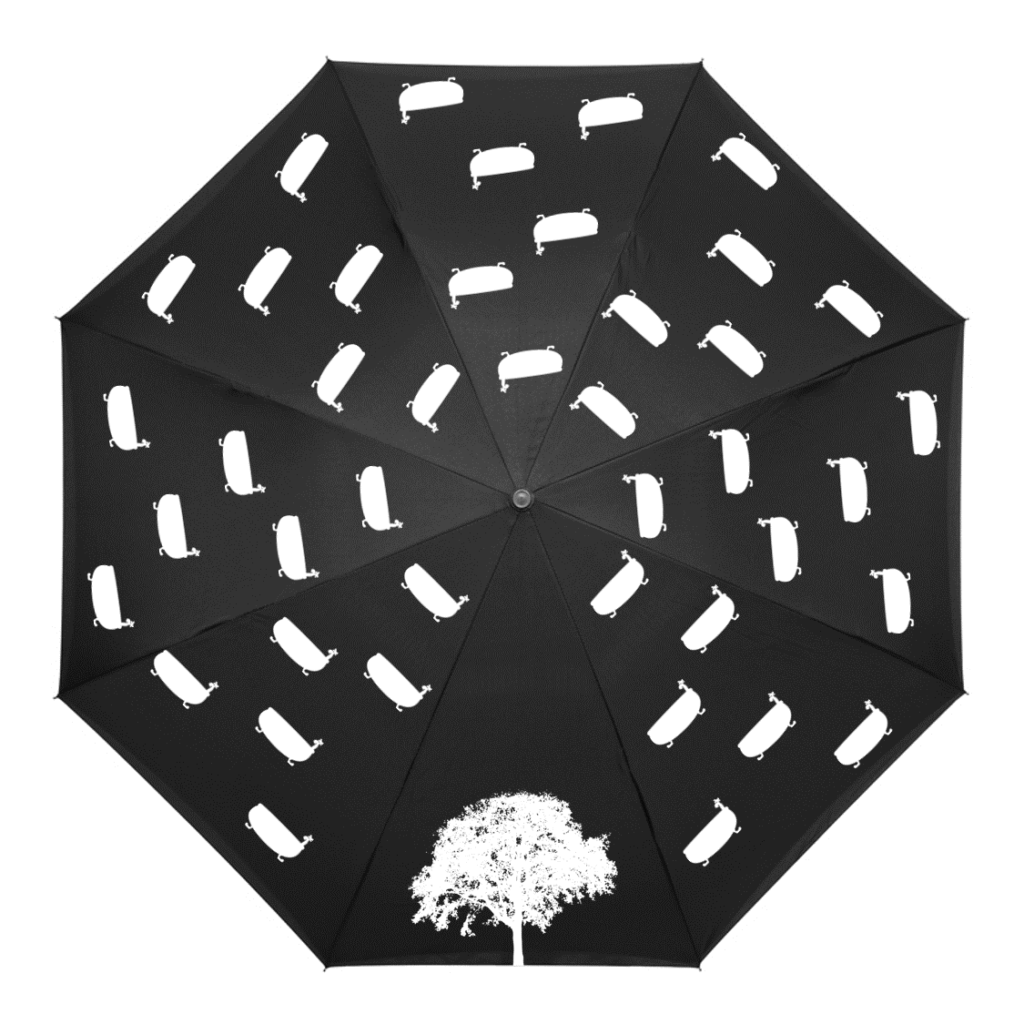
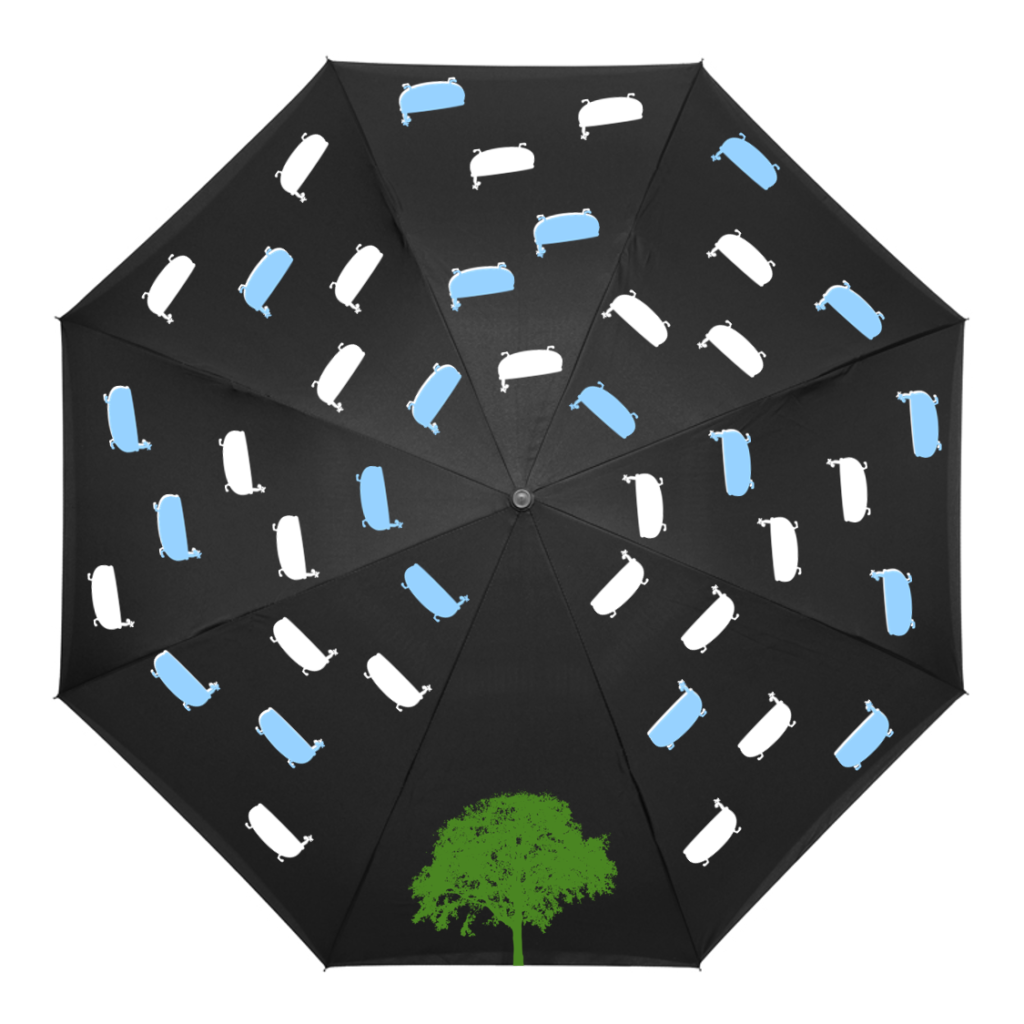
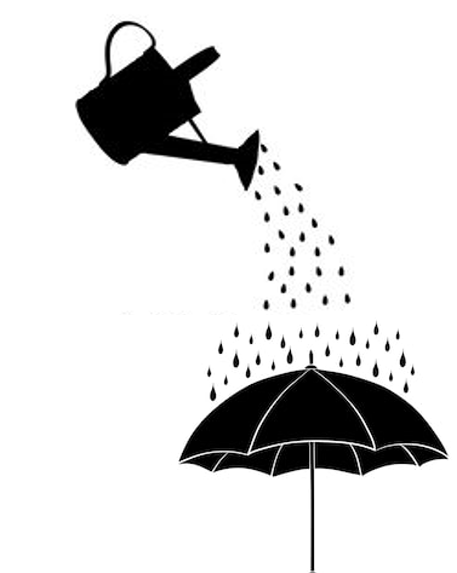
To add more information, the umbrellas would have graphics printed on them with a dye that changes from white to colored when wet, a technology that is used for novelty umbrellas. People interacting with the installation would walk through the street and pour water on the umbrellas to reveal facts about NY street trees.
For example, an average street tree will intercept 1432 gallons of stormwater each year, equivalent to about 18 bathtubs. So out of the pattern of bathtubs on an umbrella, 18 would change color. I do need to think more about this representation because it makes the values look like a percentage.
There would also be an accompanying sign with information at the end of the installation that would also direct viewers to a website to learn more, in addition to an umbrella at the end with the call to action to “Show some T(ree)LC”.
I would try to set this up so that water poured out onto the umbrellas would not be wasted, maybe by having the umbrellas sitting in a channel that collects the water which could then later be used for watering plants. In addition, I would plan to have these umbrellas to be available for sale so that people could use them in their everyday lives and engage others.
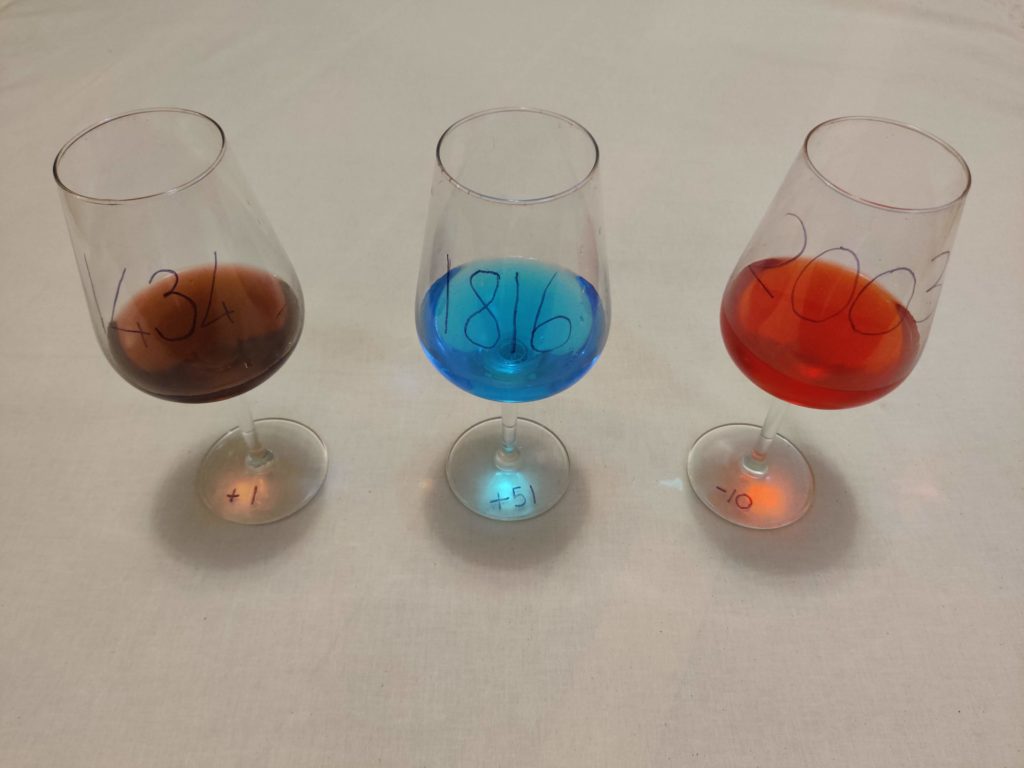
The sculpture uses the grape harvest dataset to show the harvest date across three different years. The glass contains the same quantity of liquid but coloured according to a colour scale ranging from red to blue. The earlier the date is the redder the glass, while the further ahead in time, the bluer the content, reflecting the hotter temperature experienced with earlier harvest dates (striking summer) and colder climates going towards Autumn. The year is marked on the body of the chalice, while the number of days with respect to the usual date is labelled on the base of the glass.
The choice of the colour palette allows us to strike the right visual when hitting the appropriate date, August 31st. When the harvest date is perfectly at the centre of the colour scale (0 days before or after August 31st), the wine glass assumes a purple colour, in between red and blue, making it look like a real wine glass. This also serves as a prompt for people to think that they would not drink either the blue or the red glass because they don’t seem glasses of wine at all. Only when the harvest date is the right one, wine is actually something pleasurable.
This installation could be placed together with explanations and more clear calls to actions, where people can be asked to donate to fight climate change, allowing wine to keep its purple colour.
In this sculpture I try to represent the change in the rate of grape harvest in France, hence I used only the French bottles. The number of bottles for each century maps to the grape harvest volume in that century. I chose to represent the future with a wine glass that has very little amount of wine in it to highlight the magnitude of the threat and to draw attention to the urgency of the matter.
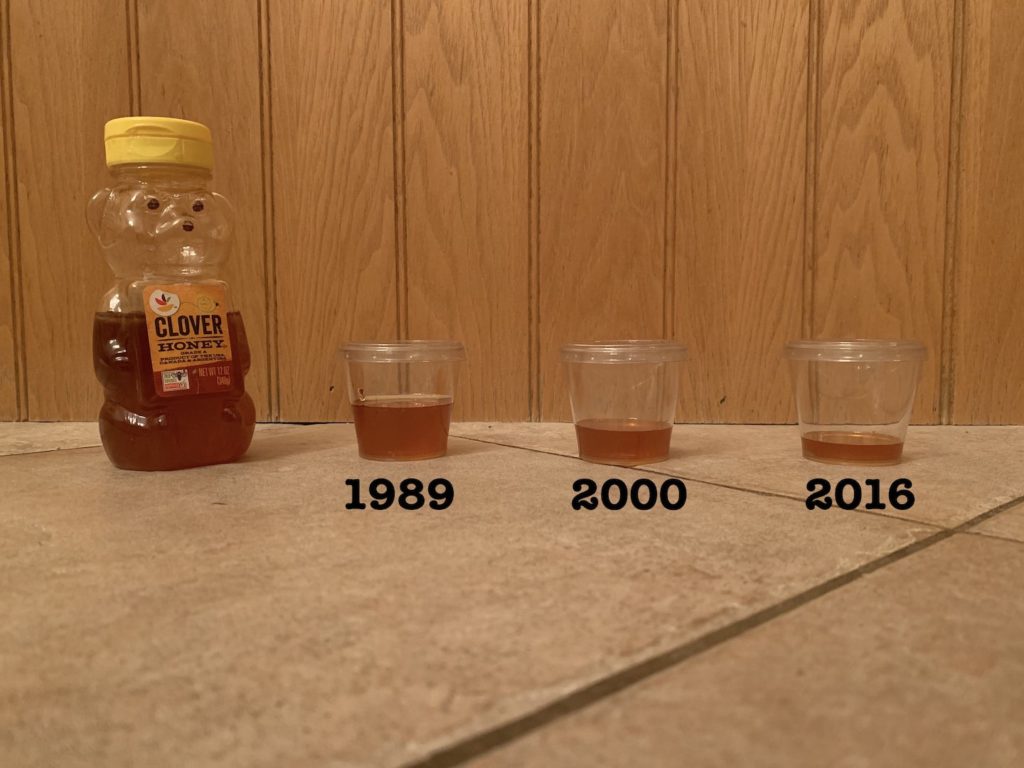
I was inspired by the bee dataset and chose three data
points tied to bee colonies from the state of California from 1989; 2000; and
2016. These three data points show a drop in bee colonies, by 30% from 1989 to
2000 and by 50% from 1989 to 2016.
Description:
I used honey (a product of bees) to demonstrate the proportion
drop in bee colonies (in this case, in the state of California for abovementioned
years); the use of honey is a way to make the issue more tangible to people (an
alternative I was considering was showing a rise in cost of honey to indicate
decreasing supply).
Audience:
The honey in jars shows clear decrease that is easy to grasp
for a wide age range. It is intended as a trigger for a wider audience, to
inspire them to do their research on what is causing drops in bees, and what
can be done about it.