For our re-imagined project, we used the Instagram video format from Olivia and Smara’s “millennial winos” sketch and the advocacy angle of Eugenio, Tyler and Neil’s “To Invest in Wine, Invest in Climate Change” sketch. We created a full 1-minute Instagram video, with stock photos and videos of people drinking wine, vineyards as well as images associated with climate change. We also interviewed Valeria Ricci from La Mesma winery in Italy, through Zoom, and used short clips from the interview throughout the video. We used an eerie soundtrack that is both reminiscent of such Instagram videos and signifies the danger wine production is in due to climate change.
Because this is an Instagram video, our audience is social media users, especially those in their 20s and 30s. The images used in the video are of young people enjoying wine in social settings, so we hope viewers will see themselves in the images. Our main goal was to alert wine consumers in their 20s and 30s to this very real impact of climate change and galvanize them to take action.
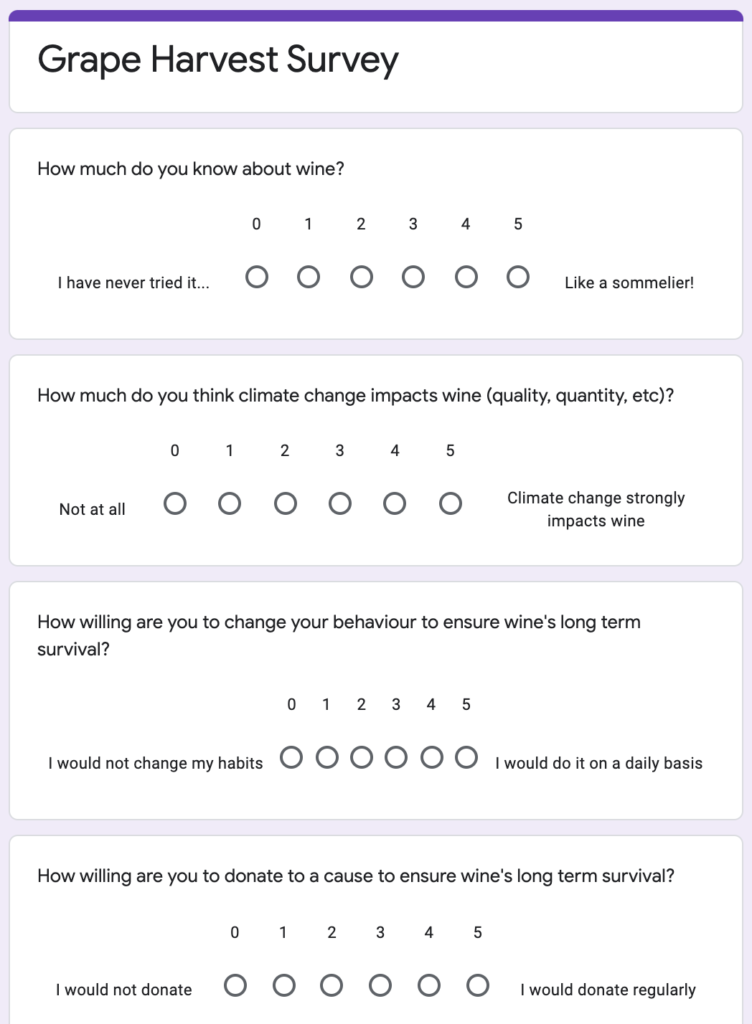
For our impact assessment, we focused primarily on investigating whether the video changed viewers willingness to pursue climate change action, such as donating to climate change funds and changing their personal behavior. We generated a Google Form that asked viewers 4 questions (one assessing previous knowledge about the issue and the rest o evaluate the base willingness to take action), had them watch the 1-minute video, and asked 3 follow-up questions to see if they were more likely to change their actions now. We also shared the video on Instagram and saw how it performed in the first 24 hours.
We shared the form with audiences in their twenties but without restricting to only wine connoisseurs at the beginning. By doing so, we were then able to collect more responses, and assessing their expertise in the form, we were able to only select those deemed passionate or wine savvy. We received 32 responses, 18 of which marked as savvy (people that self-assessed 3 to 5 in a competency scale up to 5).
On average, wine-savvy survey responders initially think that climate change’s impact on wine is 4.22 on a scale from 0 (not at all) to 5 (a key driver). After having watched the video, the same people report a 7% increase in perceived threat, stating that, on average, the impact of climate change is 4.50. More importantly, when asked “How willing are you to change your behaviour to ensure wine’s long term survival?”, people initially report 3.22 out of 5, while 3.61 after watching the video, an increase by 12%.
Finally, when asked whether they would donate to support a cause to ensure the long-term survival of wine, respondents report only 1.56 out of 5, while 1.83 after viewing the short piece, still remaining relatively low.
Because our data sketch is in the format of an Instagram post video and meant to be viewed by social media users, we also chose to share the video on a private Instagram profile with 117 followers to see how the video performed. In the first 24 hours, the video accrued 47 views (40%) and 10 likes (8.5%). The last 11 videos of the Now This News (2.3 million views) profile had an average of 133,840 views (5.8%). Obviously, a private Instagram has a curated list of followers compared to Now This News that are more likely to watch a video, but still a solid performance for a 1-minute video on wine and climate change.
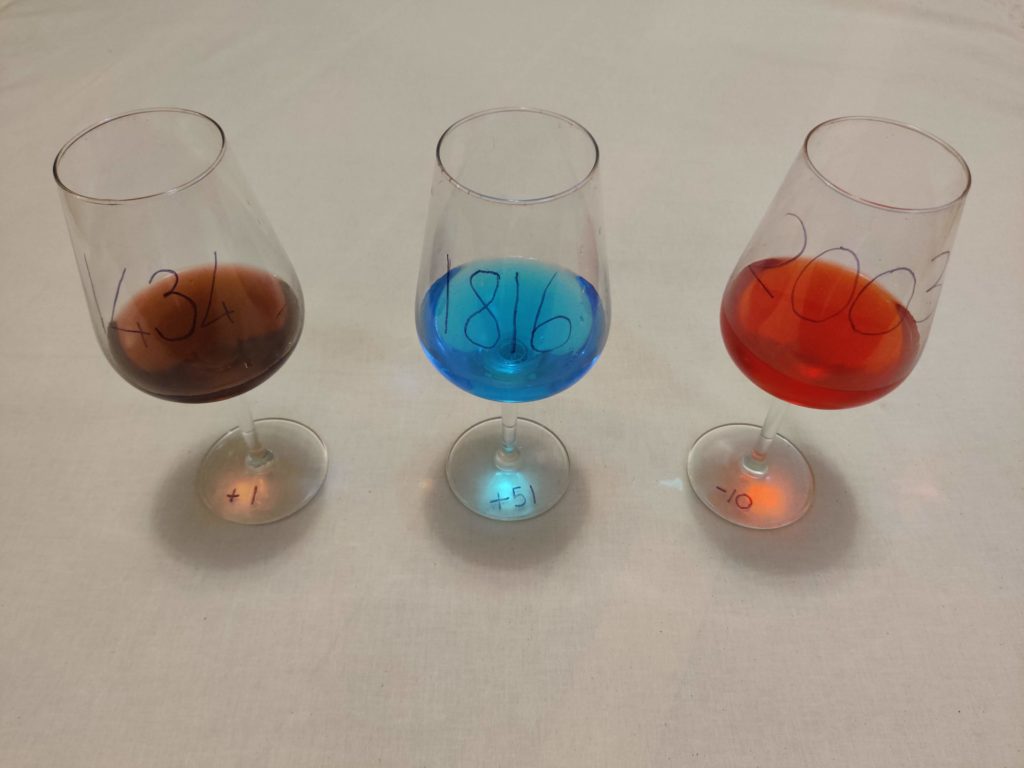
The sculpture uses the grape harvest dataset to show the harvest date across three different years. The glass contains the same quantity of liquid but coloured according to a colour scale ranging from red to blue. The earlier the date is the redder the glass, while the further ahead in time, the bluer the content, reflecting the hotter temperature experienced with earlier harvest dates (striking summer) and colder climates going towards Autumn. The year is marked on the body of the chalice, while the number of days with respect to the usual date is labelled on the base of the glass.
The choice of the colour palette allows us to strike the right visual when hitting the appropriate date, August 31st. When the harvest date is perfectly at the centre of the colour scale (0 days before or after August 31st), the wine glass assumes a purple colour, in between red and blue, making it look like a real wine glass. This also serves as a prompt for people to think that they would not drink either the blue or the red glass because they don’t seem glasses of wine at all. Only when the harvest date is the right one, wine is actually something pleasurable.
This installation could be placed together with explanations and more clear calls to actions, where people can be asked to donate to fight climate change, allowing wine to keep its purple colour.
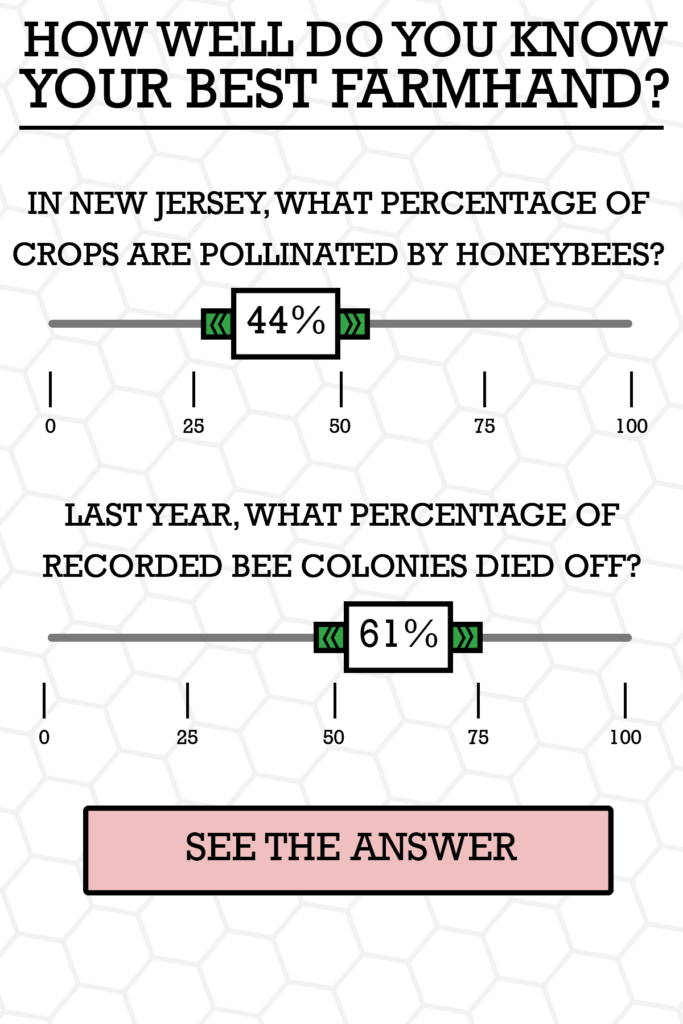
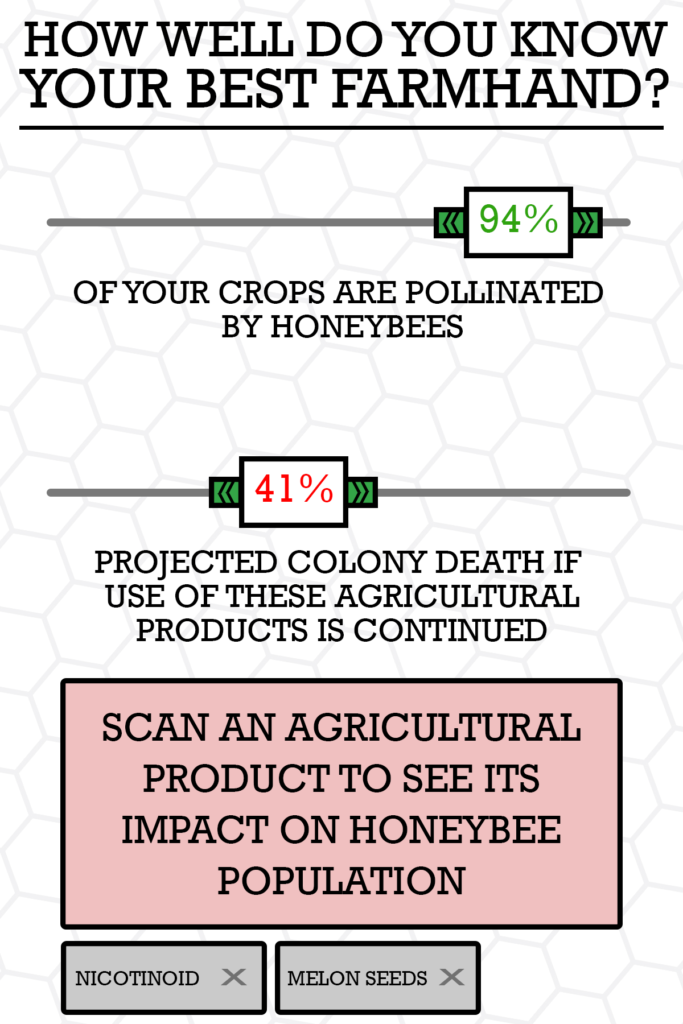
Bee population has experienced a dramatic decline over the last decades as the data say, bringing the colonies of some states in particular to record lows. We aimed at targeting farmers who can take action to effectively help to restore bee populations to sustainable levels, by using interactive questionnaires where the farmer can input his answers. We want to tell this story because it can have a positive impact on farmers practices, leading to a recovery for the bee population and better farmers products through a more aware use of pesticides.
These questionnaires are placed as touch-screens (e.g. iPads) in stores for farmers supplies, ideally closer to the check-out, where shoppers can be drawn to them by the questions. These questions consist of insights about the bee population decline over time across their state, and the impact that different pesticides can have on them. After entering their answer, the true value is shown on the screen, hopefully having a shock factor on the farmer.
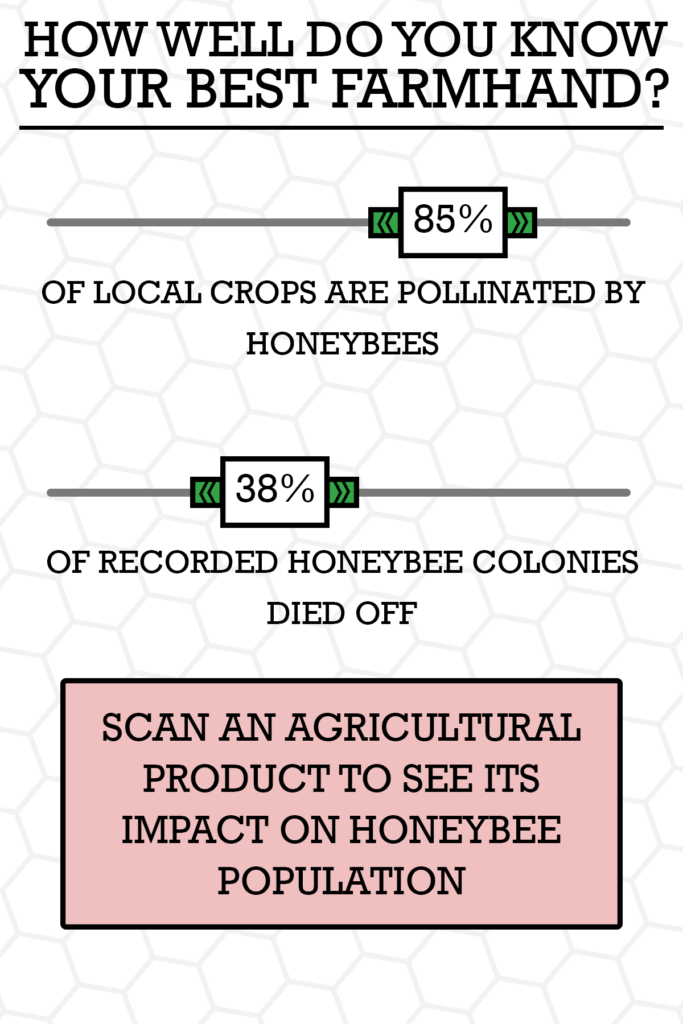
As an additional form of interactivity, the person can scan a pesticide that they are going to purchase, to see the impact that it would lead to the environment (e.g. the drop of bee population that was due to using that mix of chemicals, etc.). The farmer can then be recommended a different type of pesticide, showing a lower degree of harm to the bee population and foods.
To form the questionnaires, we used the bee population dataset, analysing the statistics of bee colonies, beekeepers and loss of population by state. This can more effectively help target states individually with statistics more relevant to each, and having a digital questionnaire makes having one per state relatively easy to do.
By Eugenio Zuccarelli, Tyler Millis and Neil Pendse
Wine has been part of our society since the beginning of humanity. The first evidence of wine-making dates back to 6000 BC and the practice spans the millennia from prehistory to the Roman Empire, through the Renaissance, all the way to the present— and we are all thankful for that.
Wine-making has become not just like any other form of activity, but almost an art. An art that over these 700 years has become not only a pleasure for the palate but a form of alternative investment, especially in uncertain times. An art so important that we have detailed records of the grape-harvesting dates for the last 700 years.
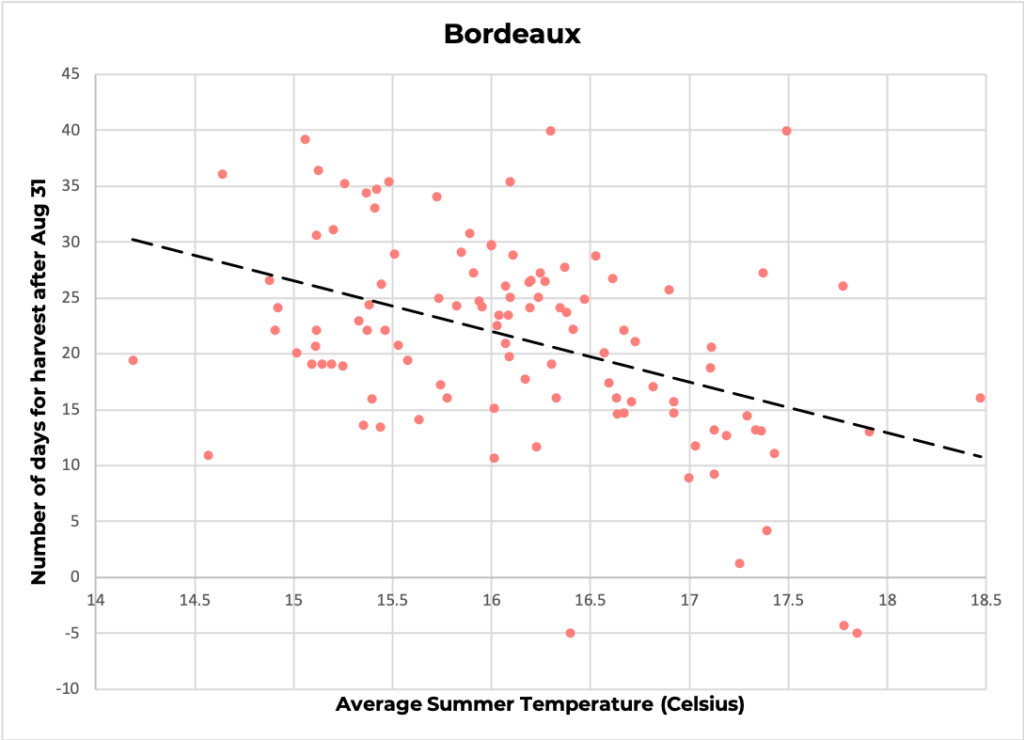
Over just the last century, however, climate change has taken a toll on wine-making. Rising temperatures have shifted the harvesting dates earlier in the year, causing the grapes to ripen faster. The harvest date is, indeed, a key element of wine-making: harvest too early and the wine will not have developed the chemicals that give each region its unique flavour; harvest too late and the grape accumulates too much sugar, making the wine more alcoholic.
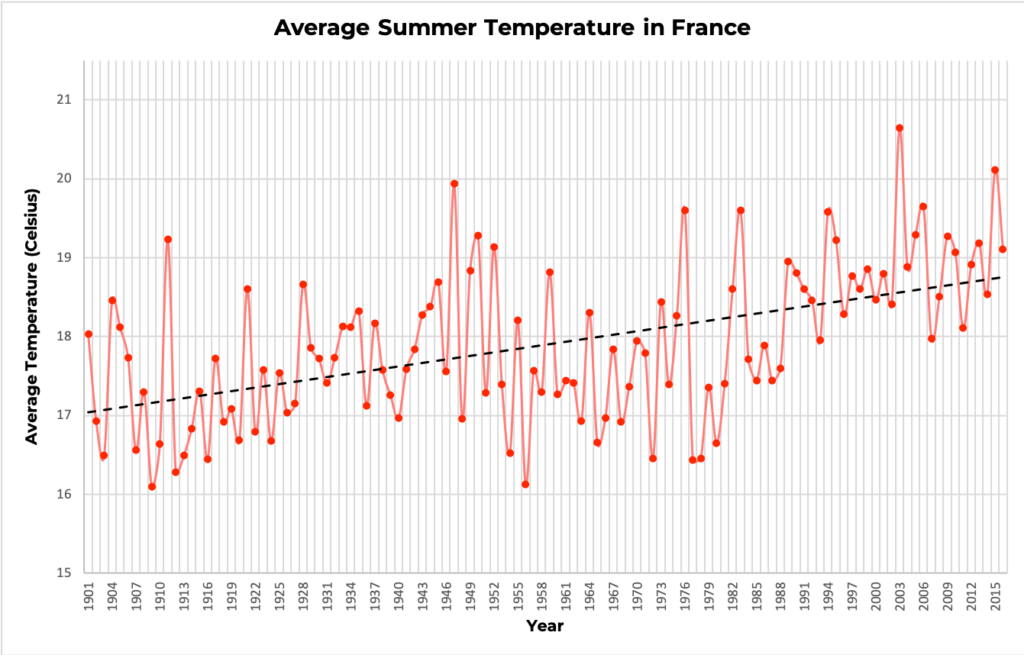
Over the last centuries, temperature and harvesting dates have oscillated together in a somewhat cyclical pattern. Temperature rose between the 10th and 14th century speeding up ripening, shifting the grape harvesting dates, which fell earlier in the summer. Temperature cooled down between 1400 and 1800, in what is called the Little Ice Age, and, correspondingly, grapes took longer to mature.
Over just 100 years, climate took such a sharp increase, that grapes are now harvested almost two weeks before the historical average. Regions in the South of France have seen harvests wiped out by rising temperature. In July 2019 alone, some regions saw temperatures as high as 45.9 °C (114.6 °F). Many governments have pledged to limit temperature rise to 1.5 °C in the next thirty years, but this limited increase alone could have disastrous effects on wine production.
This not only threatens to continue to destroy vineyards themselves but also wine investors’ gains. If we do not act now, the rapidly shifting harvesting dates will irremediably change the taste of classics such as Bordeaux and Bourgogne wines, producing wine that is neither suitable to drink nor to invest, strongly damaging wine producers, connoisseurs and investors.
Who Are We: Investigative data journalists working for a magazine such as Bloomberg or The New Yorker.
Who Is Our Target Audience: Affluent people who invest in wine and have the resources to counter climate change through policy change both at the industrial and national level.
Goal: Plots of increasing temperature aren’t convincing enough for people to take action against climate change and sometimes even accept that the climate is changing. However, it has been seen that stories which people can relate to and which are backed by data have the power to convince people about a hypothesis. In this article, we are using people’s love for wine to convince them that they need to take action against climate change.
Devin Zhang, Eugenio Zuccarelli and Fernanda Ferreira
Audience – We imagine our data story as a slice of life article about the MIT at Mass Ave Blue Bikes station intended for the MIT community. It’s easy to look over things around campus, and this article will point out to readers that this specific station is the most used in the entire Blue Bikes system.
Summary – Total trip data show that the MIT at Mass Ave is a cut above the rest of the Blue Bike stations, representing 4.7% of total station visits. We want to tell this story because looking at the data more closely, and especially moving from the data to interviewing MIT students and Patrick Kelsey at Blue Bike, allowed us to explore what exactly drives this station’s popularity.
All of our trip data came from Blue Bikes and sifting through this data we saw that not only is the MIT at Mass Ave Station the most popular in the system by a relatively large margin, but we were able to explore why that is. The Blue Bikes data includes information on start and end stations, as well as the time and day of the trip. With that we were able to show that many of the trips to and from the MIT at Mass Ave Station are to Blue Bike docks within the MIT campus or relatively close to it. We also explored how the use of the Blue Bike rides that involved this station changed over the course of a week and a month during 2019. This demonstrated that the highest peak of Blue Bike rides from MIT at Mass Ave occurred in September, after the start of classes when students are fully back on campus but not yet drowning in work. We then spoke to MIT students that use Blue Bikes to confirm that a lot of the rides they take are short and focused on getting around campus, such as from dorms to class. Lastly, we talked to Patrick Kelsey, the marketing manager at Blue Bikes, to get his take on the station’s popularity. In talking to Kelsey, we learned that MIT employees and students make up a substantial portion of Blue Bike annual members and that MIT provides a hefty subsidy for the annual membership. All in all, by looking at both the data and by speaking to students and Patrick Kelsey we were able to describe what drives the popularity of the MIT at Mass Ave Station, which is the large MIT user base and the type of trips (short and around campus) that start and end at this station.
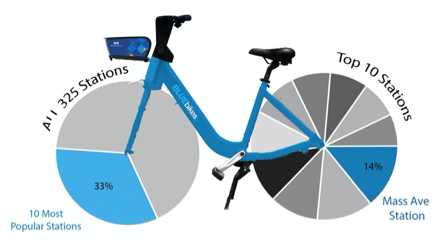
There are 325 Blue Bikes stations in the greater Boston area, forming a sea of docks across Somerville, Cambridge, Boston, Brookline and, more recently, Everett. These stations represent start and end points for the over 3,500 bikes in the ride sharing system, which arrived in Boston in 2011 with a modest 61 stations and 610 bikes. Throughout 2019, these 3,500 bikes were taken on over 2.5 million trips. 4.7 percent of those trips started or ended here at MIT, at the Mass Ave station.
On the corner of Massachusetts Avenue and Amherst Street, the station is snug against MIT Hillel and has docks for 27 bikes. Last year, 118,047 bikes visited the MIT at Mass Ave station, making it the most popular station in the ride sharing system. Central Square, which came in second, saw almost 16,000 fewer trips.
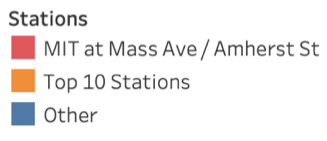
A cut above the rest. The ten most popular stations in the bike ride sharing system make up 33% of all 2.5 million rides. Of the top 10 stations, the MIT at Mass Ave station takes a 14% slice. In total, bike trips to and from this MIT station represent 4.7% of total trips taken in the year. Bike photo courtesy of Blue Bikes.
The popularity of the MIT at Mass Ave station came as a surprise for some MIT students. “I know it’s a busy station,” said Kevin Lin, a master’s student in Business Analytics. “But I did not expect it to be the most used,” he added. Pierre-Henri Ramirez, also a master’s student in Business Analytics, thought the most popular station would be the one on the corner of Main St and Ames, which saw 85,425 trips in 2019, earning it the fourth place in terms of total trips.
For other students, particularly those who routinely dock their bikes at the MIT at Mass Ave station, the data was less surprising. Desiree Waugh, a master’s student at Sloan, for instance, often leaves her bike at this station because it usually has docks available.
According to Patrick Kelsey, the marketing manager for Blue Bikes, the popularity of this station is driven primarily by one factor: the number of MIT users in the bike ride sharing system. “MIT makes up a substantial part of our riders,” said Kelsey. Blue Bikes has about 23,000 annual members and 3,500 of those are part of the MIT community. This, says Kelsey, is largely due to the incentives MIT provides that make it financially easy for the MIT community to use Blue Bikes. MIT subsidizes annual memberships for employees and students, dropping the price from $99 to $35. Harvard University, on the other hand, only offers the annual membership with a $29 discount; Harvard affiliates end up paying $70 dollars for the annual membership, twice what the MIT community pays.
With such a heavily discounted membership, it’s unsurprising that MIT uses these bikes to get around campus.
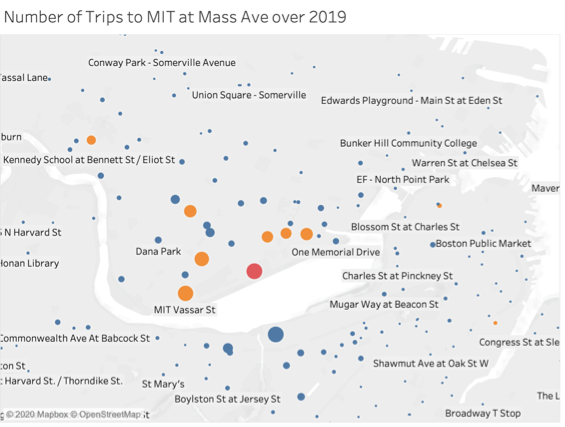
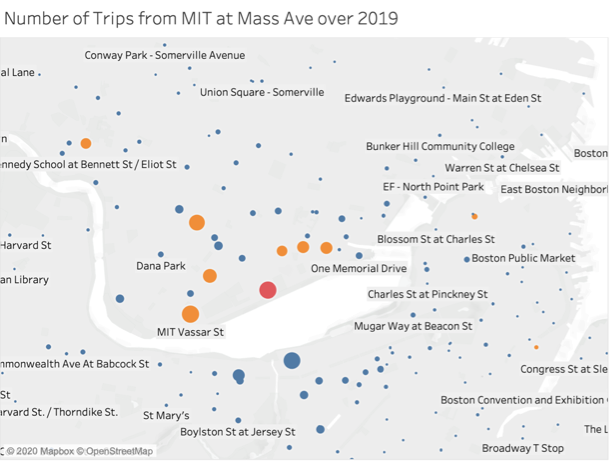
Data looking at to and from trips from the MIT at Mass Ave Station show that a lot of the trips involve stations either on MIT’s campus or in the nearby vicinity. The two maps on the left show trips to (top) and from (bottom) this station to other Blue Bike stations in Boston and Cambridge. Each point represents a single station and the larger the point, the more trips there were between that dock and the MIT at Mass Ave station, which is represented in red.
Many MIT students use the Blue Bikes system for short trips, such as riding from their dorm to class and back. Desiree Waugh, for instance, uses Blue Bikes to commute from Tang Hall to MIT on a weekly basis.
With so many MIT students using Blue Bikes to get around campus, it’s unsurprising that seven of the top 10 stations are not only in Cambridge, but also close to campus. The eighth Cambridge station is in Harvard Square, which also sees a good number of ride flux with the MIT at Mass Ave station.
Only two Boston stations are amongst the top ten–South Station and North Station in fifth and sixth, respectively –, and though both saw total station visits in the 80,000s, the community that uses them is mostly independent from the MIT community.
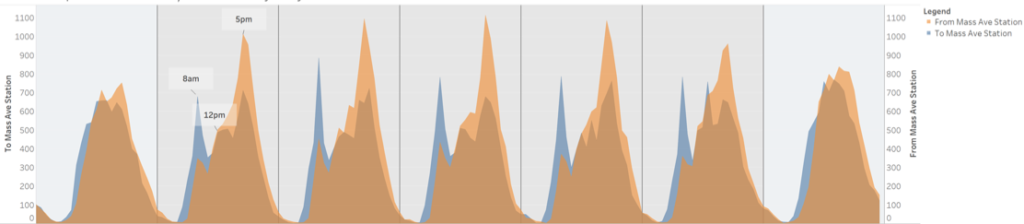
MIT students may turn to Blue Bikes to get them to class on time, but that doesn’t mean they aren’t taking advantage of the system during the weekends. Hourly trip data for the MIT at Mass Ave Station over the course of a single week shows that while the highest numbers of trips are reached during the weekdays, especially during peak rush-hour, weekend stats for this dock aren’t too shabby. Classes may not be happening, but MIT students still go to lab, to the library, to see friends and also use the system to complete errands. Anis Ben Said, a master’s student at Sloan, for instance, said he uses Blue Bikes when getting groceries during the weekend.
The MIT at Mass Ave Blue Bikes station does see higher numbers of total trips during the week, but it’s still popular on the weekends.
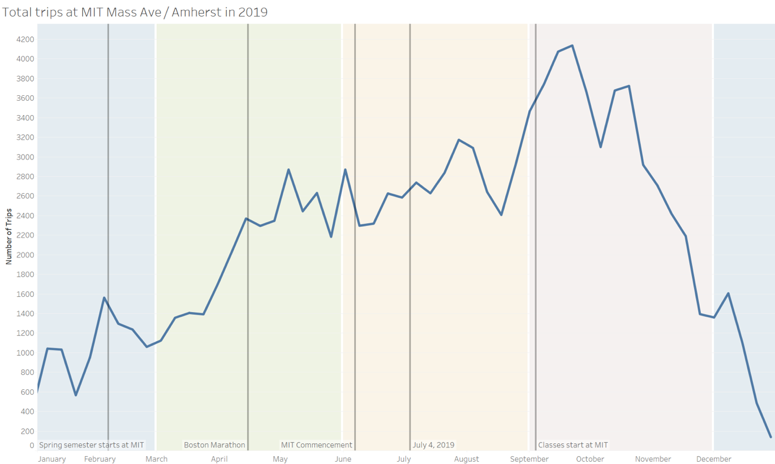
With the MIT community representing such a large slice of total Blue Bikes members and having such an outsized effect on trips to and from the MIT at Mass Ave Station, it’s not surprising that during 2019, the station saw its highest numbers of visits during September, particular in the two weeks after classes start.
Weather driven. Total visits to the MIT at Mass Ave station follow seasonal trends and reach their highest peak in September, when MIT students arrive back in campus.
Over 2019, total trips to and from the MIT and Mass Ave station waxed and waned with the weather. After an inexplicable peak in October, the total number of visits begins a steep decline, broken only by a short peak as classes end in December. Once students are back in January, the numbers begin to inch up, but they really hit their stride once the weather starts getting warmer.
With so many users, so many visits, at first it seems strange that the MIT at Mass Ave Station isn’t part of Blue Bikes valet service, which can expand the number of docks and bikes at specific stations during peak hours. Two Cambridge stations have the valet service and both are on the MIT campus: Kendall St and the Ames St at Main St station. But Kelsey had an explanation for this. “There’s bidirectional demand at this station,” he said. This means that bikes are always arriving and leaving this station, decreasing the chance that it run out of either bikes or available docks. This means that the MIT at Mass Ave Blue Bike is not only popular, it’s also considerate.