-Sarah Mousa

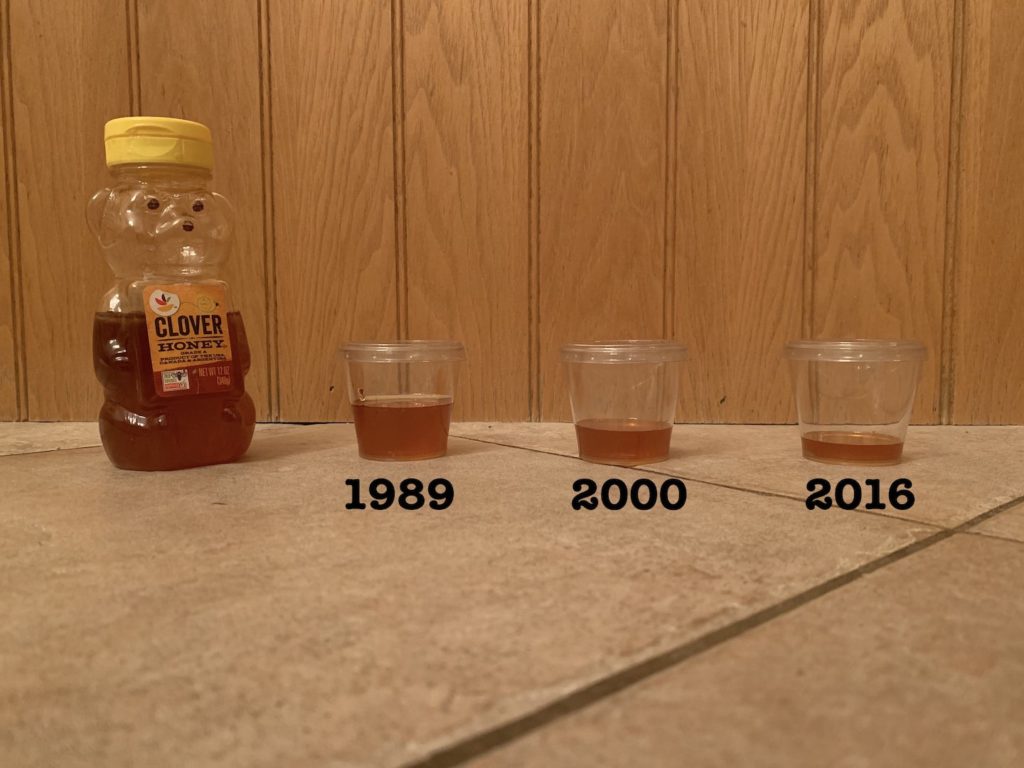
I was inspired by the bee dataset and chose three data points tied to bee colonies from the state of California from 1989; 2000; and 2016. These three data points show a drop in bee colonies, by 30% from 1989 to 2000 and by 50% from 1989 to 2016.
Description:
I used honey (a product of bees) to demonstrate the proportion drop in bee colonies (in this case, in the state of California for abovementioned years); the use of honey is a way to make the issue more tangible to people (an alternative I was considering was showing a rise in cost of honey to indicate decreasing supply).
Audience:
The honey in jars shows clear decrease that is easy to grasp for a wide age range. It is intended as a trigger for a wider audience, to inspire them to do their research on what is causing drops in bees, and what can be done about it.