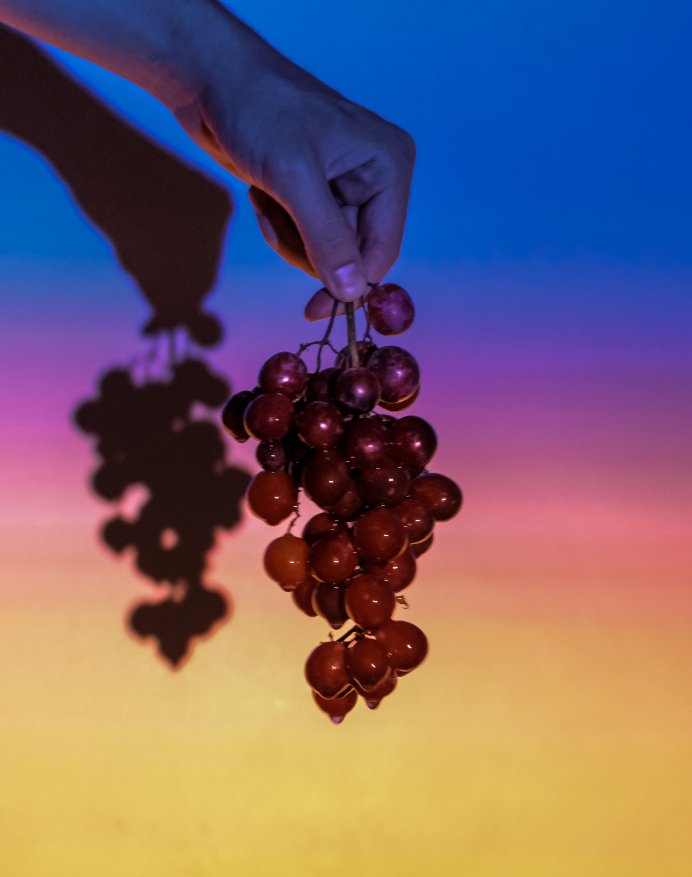
I used the grape vine as a sculpture of the geographic story about how climate change has affected wine. I tried to incorporate three senses (taste, touch, sight) to capture more of the data.
Taste: I poked holes in the grapes on the bottom of the vine and soaked the grapes in a sugary solution for a couple of hours. After this, the grapes on the bottom were significantly sweeter (disgustingly so) than the non-soaked grapes at the top.
Touch: because of the high concentration of the sugary solution, the grapes at the bottom were much softer and felt wilted. This fit in with the concept that grapes are ripening faster on the vine and going bad in the heat. In addition, the grapes were sticky and really unpleasant to the touch.
Sight: I wanted to communicate how heat was changing the taste of the grapes, so I created a gradient of hot to cold (orange to blue).
In the end, the grapes near the top were more desirable, showing that wine growing regions are moving north.
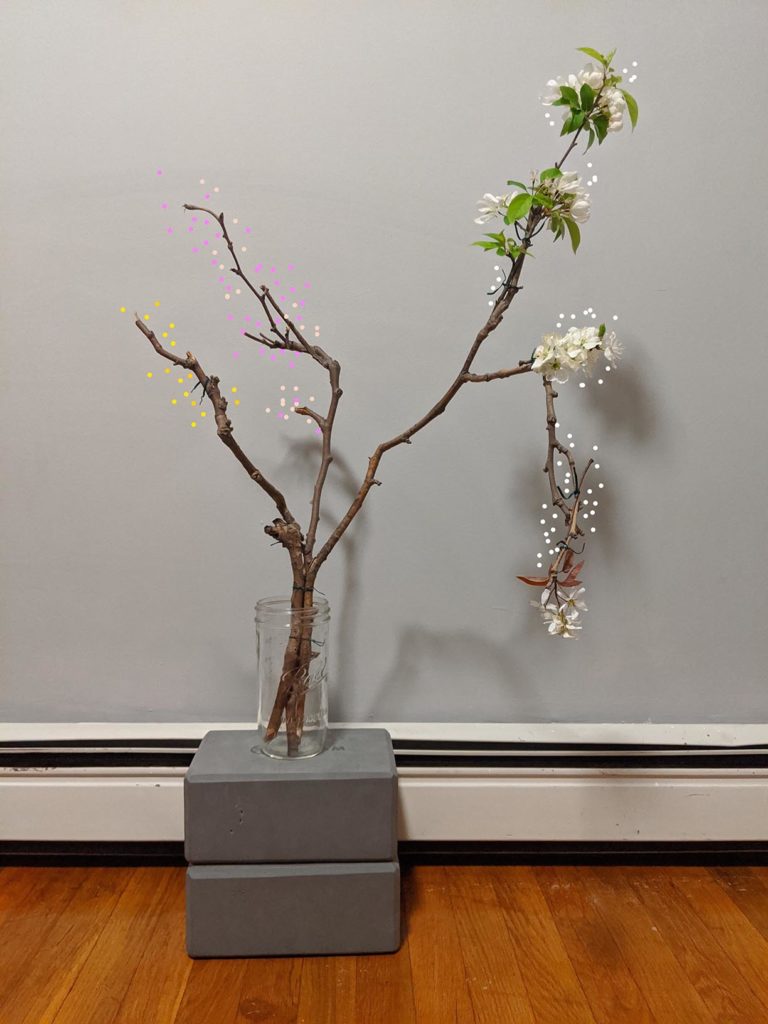
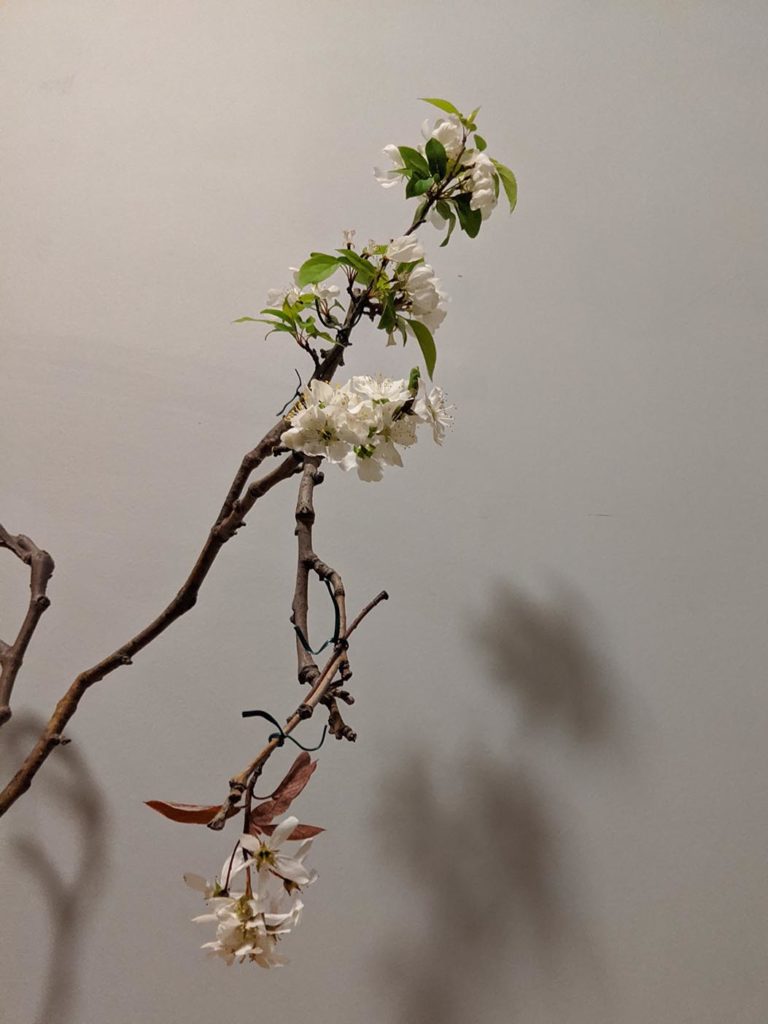
The sculpture attempts to be an approximation of a tree, where the different branches are all the different trees that are in bloom in a neighborhood right now. Larger branches correspond to a larger population of trees (in this sketch, the white flowers have the largest branch), and the number of branching moments corresponds to the number of tree species that fit in that category of flower color.
In pursuing high fidelity in terms of materials, I ended up a little limited in palette (also, I should clarify — these are all fallen branches, no trees were harmed!)
Data: 2015 data from the NYC Tree Census from the NYC Parks Department. ++ information on tree flower colors
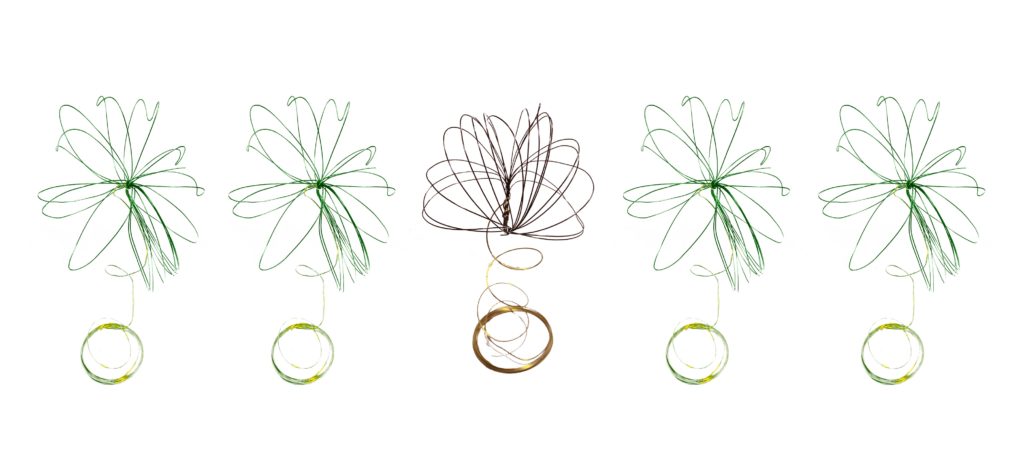
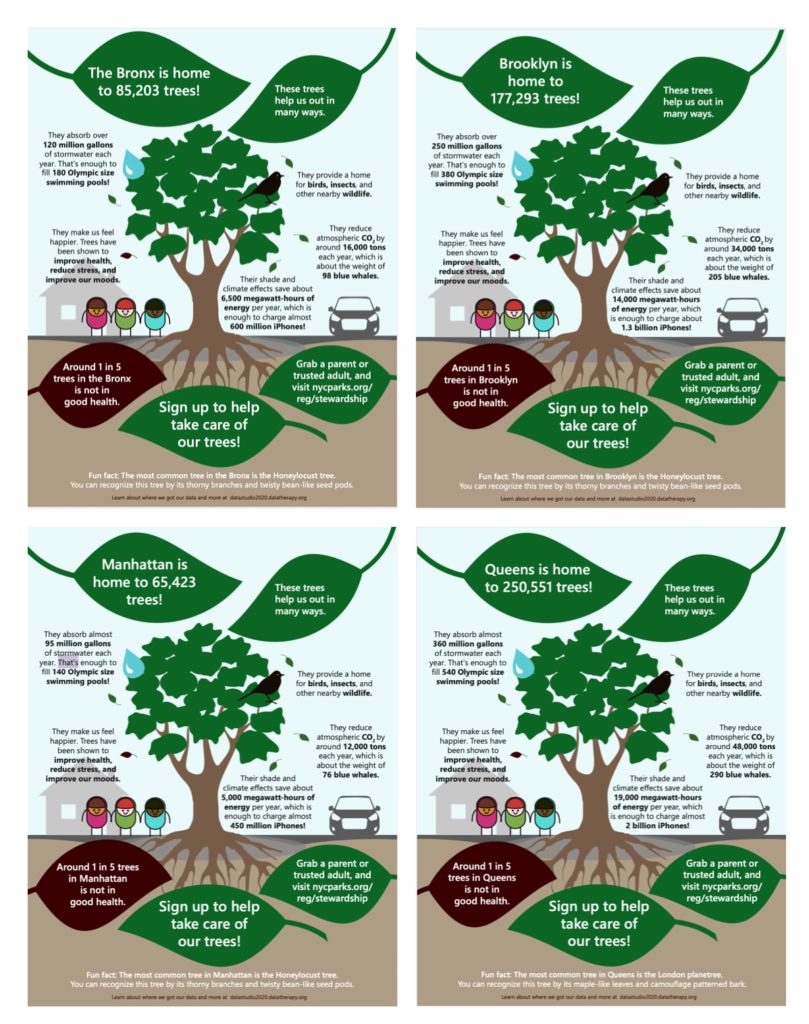
For this sketch, I created wire sculptures to represent the proportion of trees in New York City that are in good health. These wire sculpture kits would be handed out to students in a New York City elementary school art class, with 80% of the students with materials to create a healthy tree (green tree), and 20% of the students with materials create an unhealthy tree (brown tree). The idea is that after students notice that not everyone has the same wire tree kit, there would be discussion and dialogue about the health of trees in New York and how students can get involved. The handout created in a previous sketch (pictured below) would then be distributed to students.
The idea of this sculpture is to map the effect of climate change of wine production. The medium is a video in a wine store or a restaurant and the audience is people who visit this establishment. The goal of this video is to make people, who love wine aware of the fact that they might not have their favorite wine a few years down the line and encourage them to donate to causes which are fighting climate change.
As the average temperature has increased in the past half century viticulturists today are forced to harvest the grape crop much earlier than the ones from two generations ago did. It’s all good and well today because the grape crop is still being produced but there’s a scare that with increasing summer temperatures, in the distant future, regions around the world which are known for their wine won’t be able to produce any grape crop. One such region is Bordeaux!
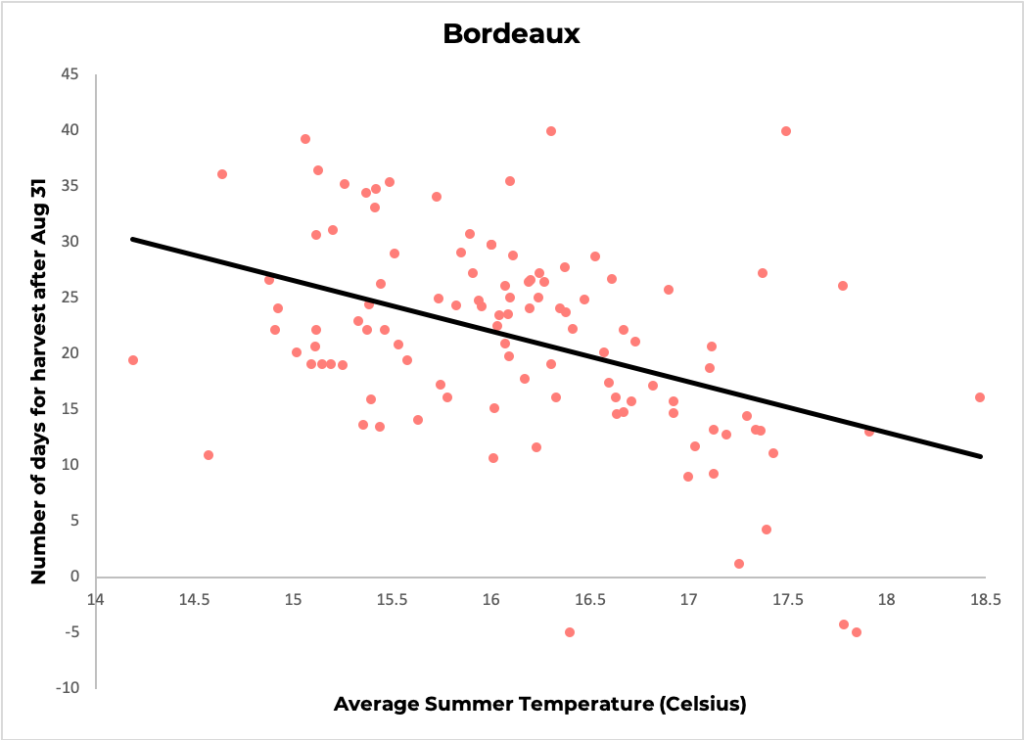
Viticulturists from Europe have maintained logs of harvest dates for the past 650 years [1]. A simple scatter plot shows that as the average summer temperature increases the harvest date gets nearer to August 31 (number of days for harvest after August 31 is used as a standard measure in this industry).
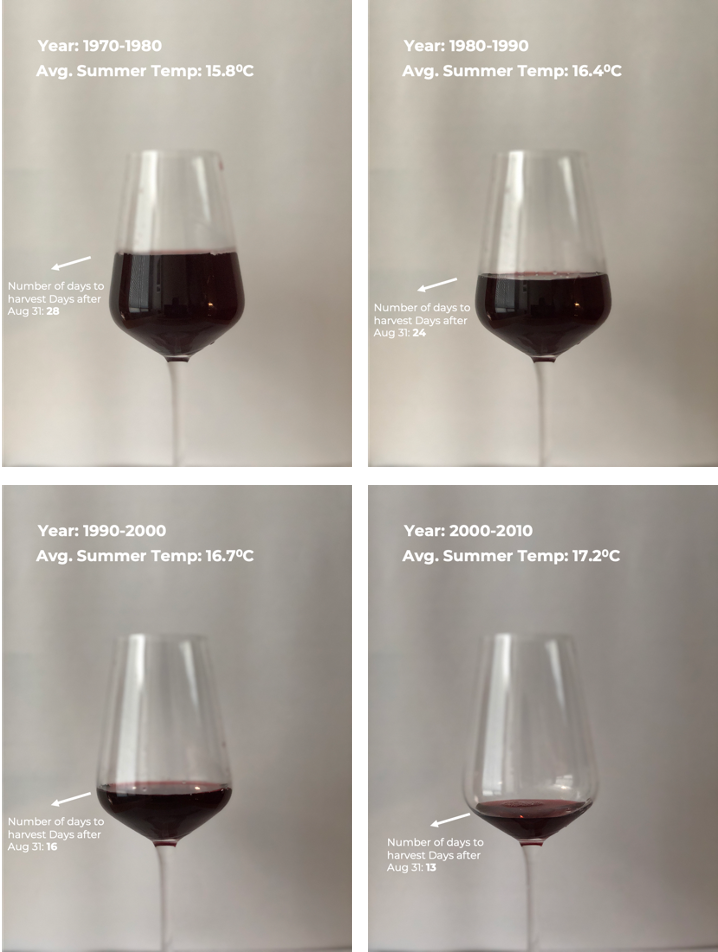
I used wine itself to represent this trend. The amount of wine in the glass is indicative of the harvest date. More the wine later the harvest date (which is better) and lesser the wine earlier the harvest date (which is bad).
The sketch below shows this trend for 4 different cases (values are averaged over 10 years to smoothen the values).
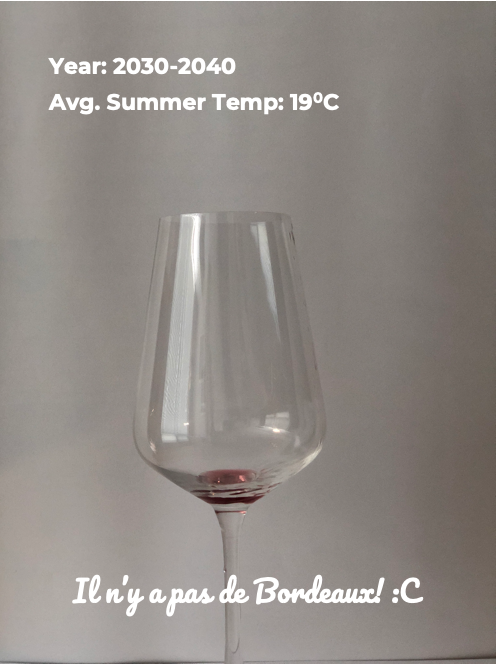
After showcasing this trend, the audience sees another glass which is empty. This represents the future, where the average summer temperatures have made it impossible to produce wine in Bordeaux (the data here is just a guess and lacks scientific backing). The audience will be asked to take an action (donate to a cause which fights climate change).
References: [1] Daux, V., I. Garcia de Cortazar-Atauri, P. Yiou, I. Chuine, E. Garnier, E. Le Roy Ladurie, O. Mestre, and J. Tardaguila. 2011. An open-database of Grape Harvest dates for climate research: data description and quality assessment. Climate of the Past, Vol. 8, pp. 1403-1418, 2012 www.clim-past.net/8/1403/2012/ doi:10.5194/cp-8-1403-2012
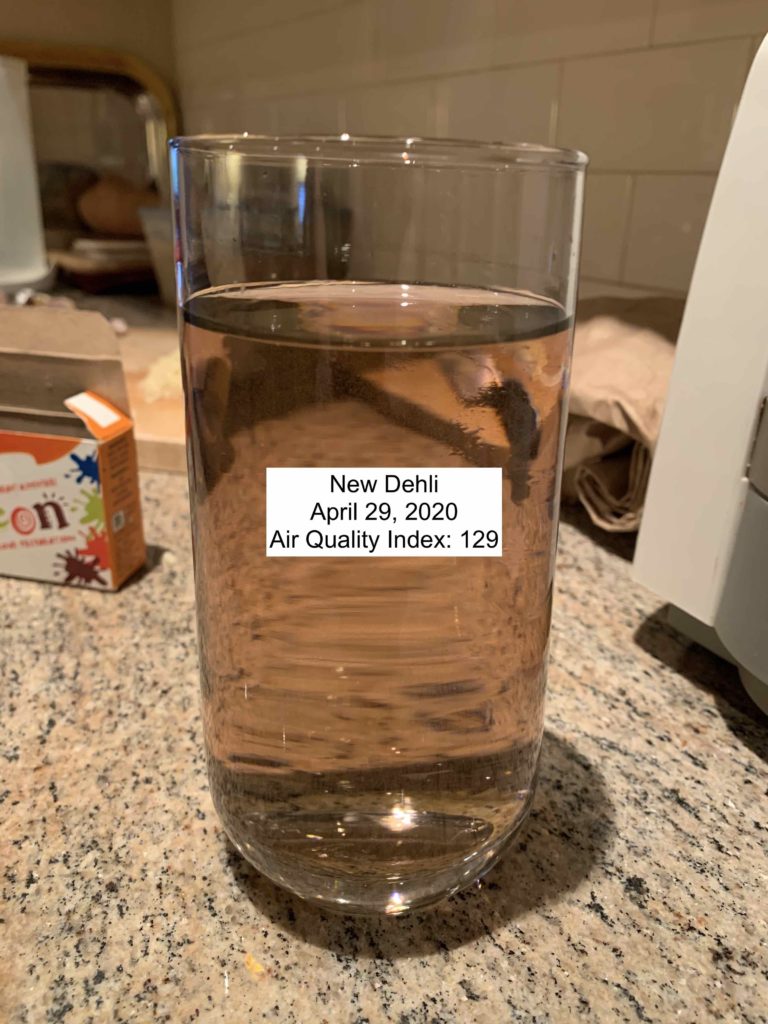
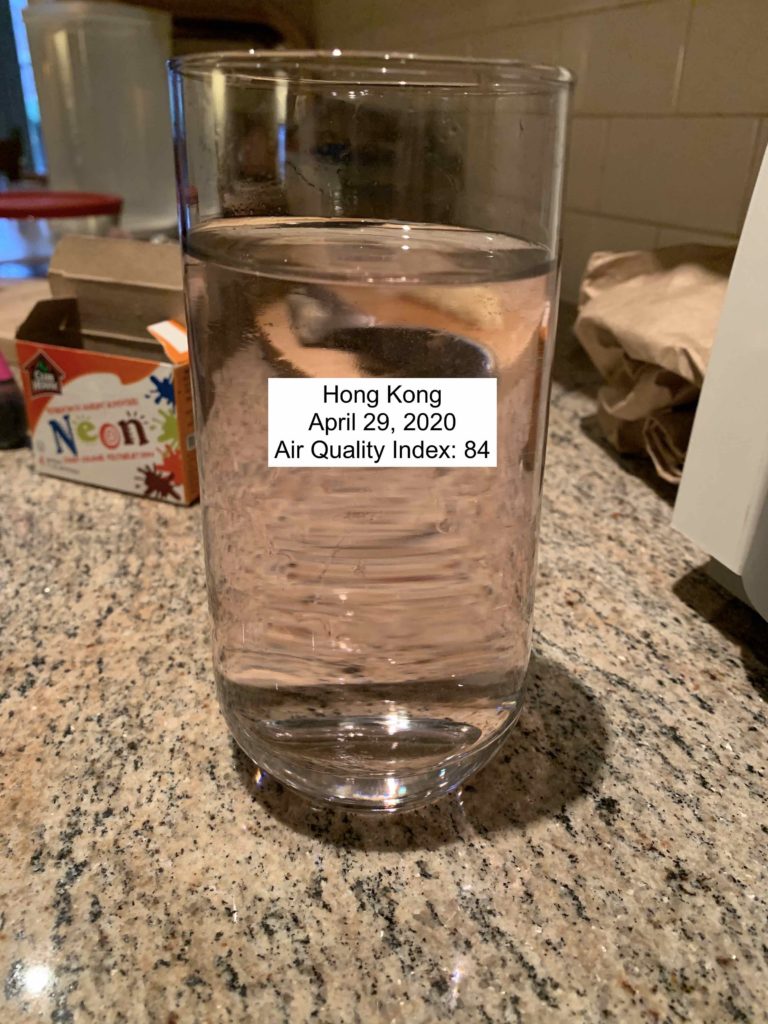
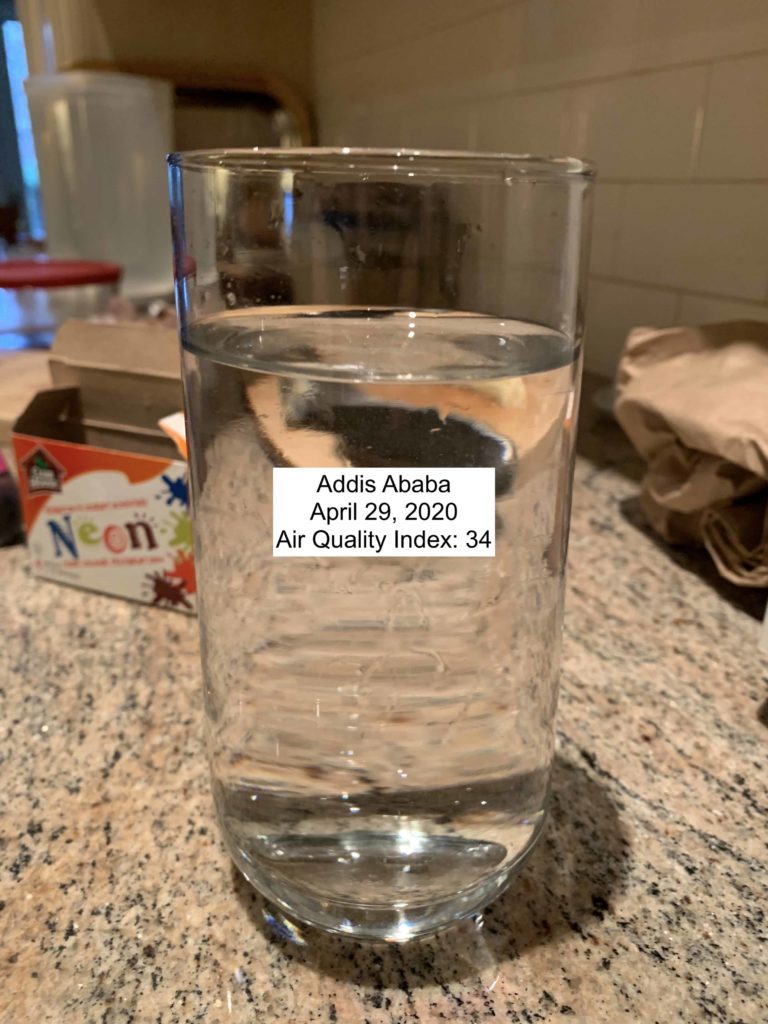
I wanted to experiment with using water as a medium for data storytelling. In particular, I thought water could be an interesting way to tell data stories through other senses like taste and touch.
The dataset I’m using is the air World Air Quality Index Project dataset. In the original data story I worked on, we tried to make pollution tangible by showing it through video filters. In the same vein, I wanted to show air pollution by mixing food coloring and water according to how much pollution is in the air at a given place and time.
The audience of the data story would select a time and location and then drink the water associated with that air quality index reading. Potentially this could be used to compare between places or a single place over time. I think the latter would be more effective because you could “drink” the air of your home 100 years ago to feel the difference.
Since the video filters were originally a data story for GreenPeace, this could be an in person component of this campaign for canvassers to use. The feeling associated with drinking murky water would hopefully help create an emotional response to poor air quality and generate support for the fight to reduce air pollution.