Data Source
This data sculpture uses the global air quality dataset (https://aqicn.org/data-platform/register/), showing daily air quality readings in cities around the world. In particular, high concentrations of PM2.5, or small particles less than 2.5 microns in diameter, are known to have a number of health effects and are a common indicator of air quality.
Audience
The intended audience would be for a group of kids or students, either in a classroom setting or somewhere public (like in a museum) where many students would be able to interact with the exhibit.
Concept
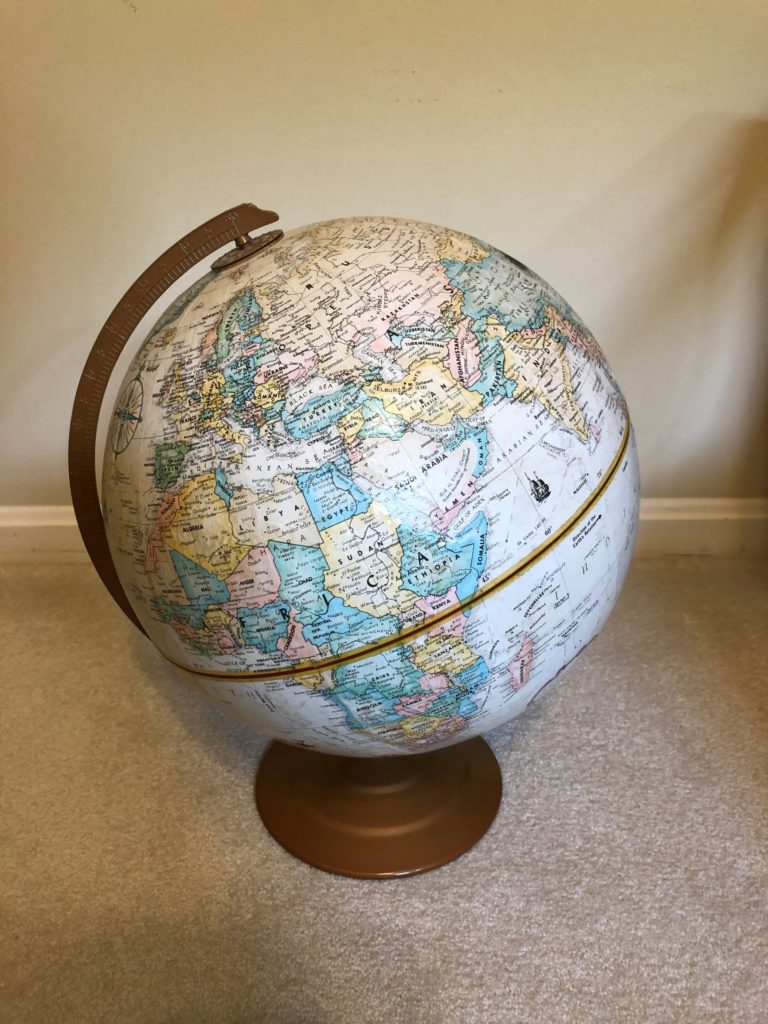
In our previous participatory sketch using the air quality data set, we wanted the audience to be able to place themselves in the data by picking where they live or a location of their choice to compare air quality data. In this sketch, we take this concept to a physical level by representing air quality on a physical globe.
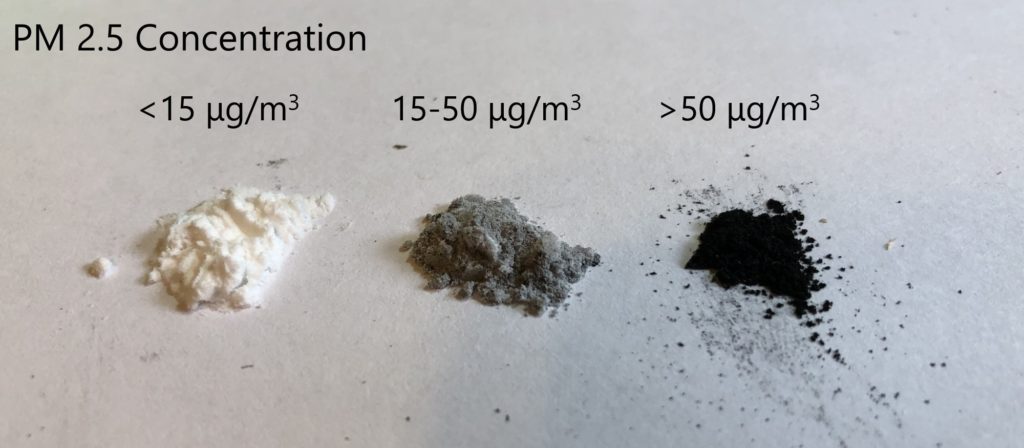
Air quality is represented by the color of various fingerprint mediums ranging from white to black. The mediums are simply a mixture powders (cornstarch and graphite powder) to create various shades of grey, with darker colors representing worse air quality. For this sketch, I was only able to create three different shades, but a more fully developed idea could use more granular shades and possibly ink instead of powder. The idea is that students would look up the yearly average air quality for a specific location (e.g. their hometown), and then create a fingerprint on the globe using the corresponding color/shade.
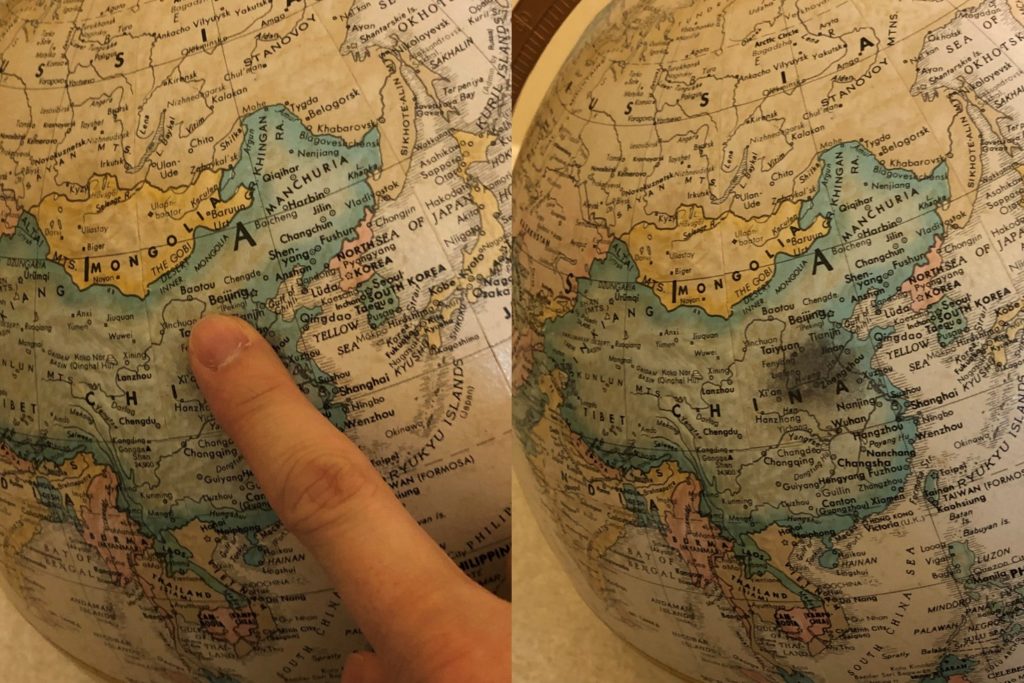
If there is a large group of students or other audience members, they would choose various locations around the world, with some overlap. As the fingerprints grow, there is an effect of ‘smog’ covering the areas with poorer air quality, whereas locations with better air quality would not see much of a change. In an actual sculpture we would likely use a globe with less coloring so that the fingerprints stand out.
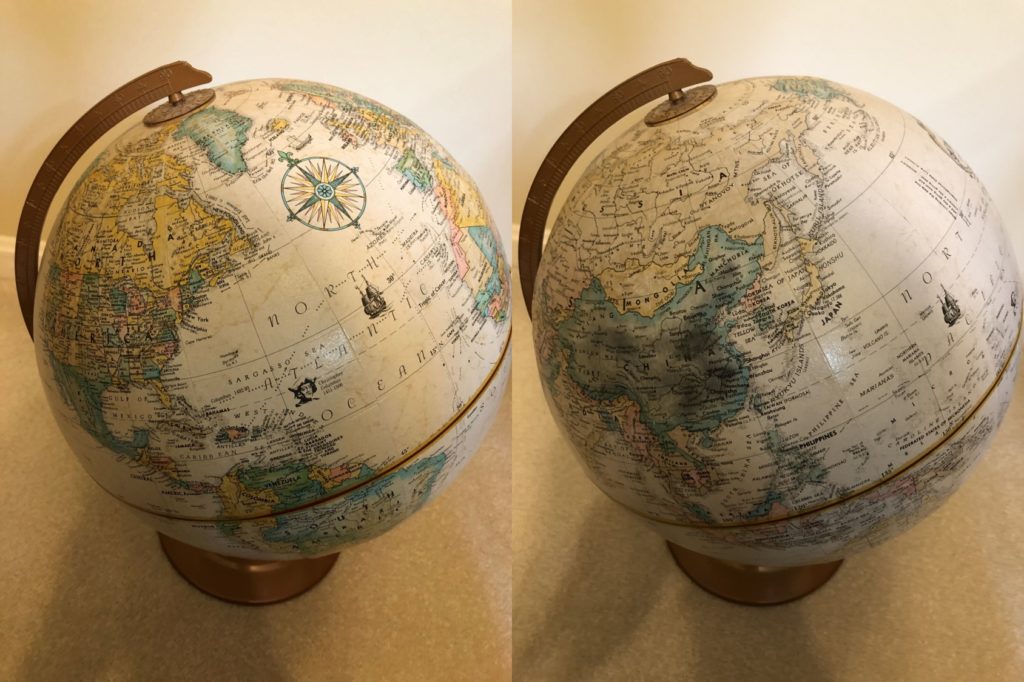
The eventual gray shading of areas with poorer air quality is an impactful effect and would hopefully help visualize the global impact of pollution. In addition, there is the effect of students feeling like they participated and left a part of themselves on the sculpture, so hopefully they feel that they may be able to make an impact on the solution.
