A Better Tool to Narrow Down Your Car Purchasing Options

Tyler Millis, Robert M. Vunabandi

Background

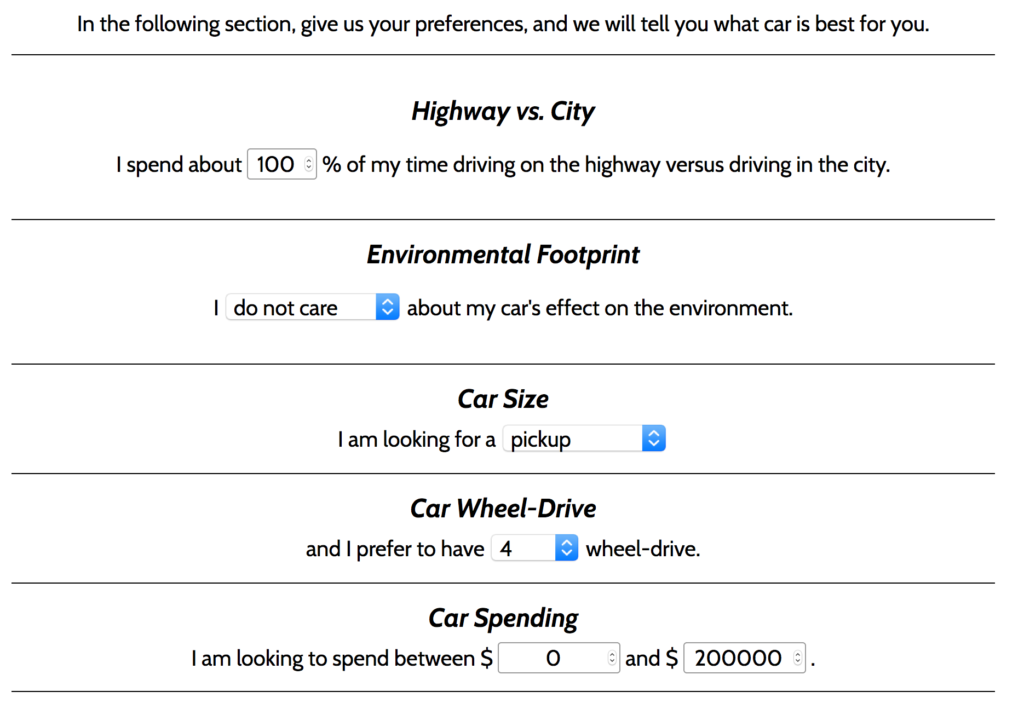
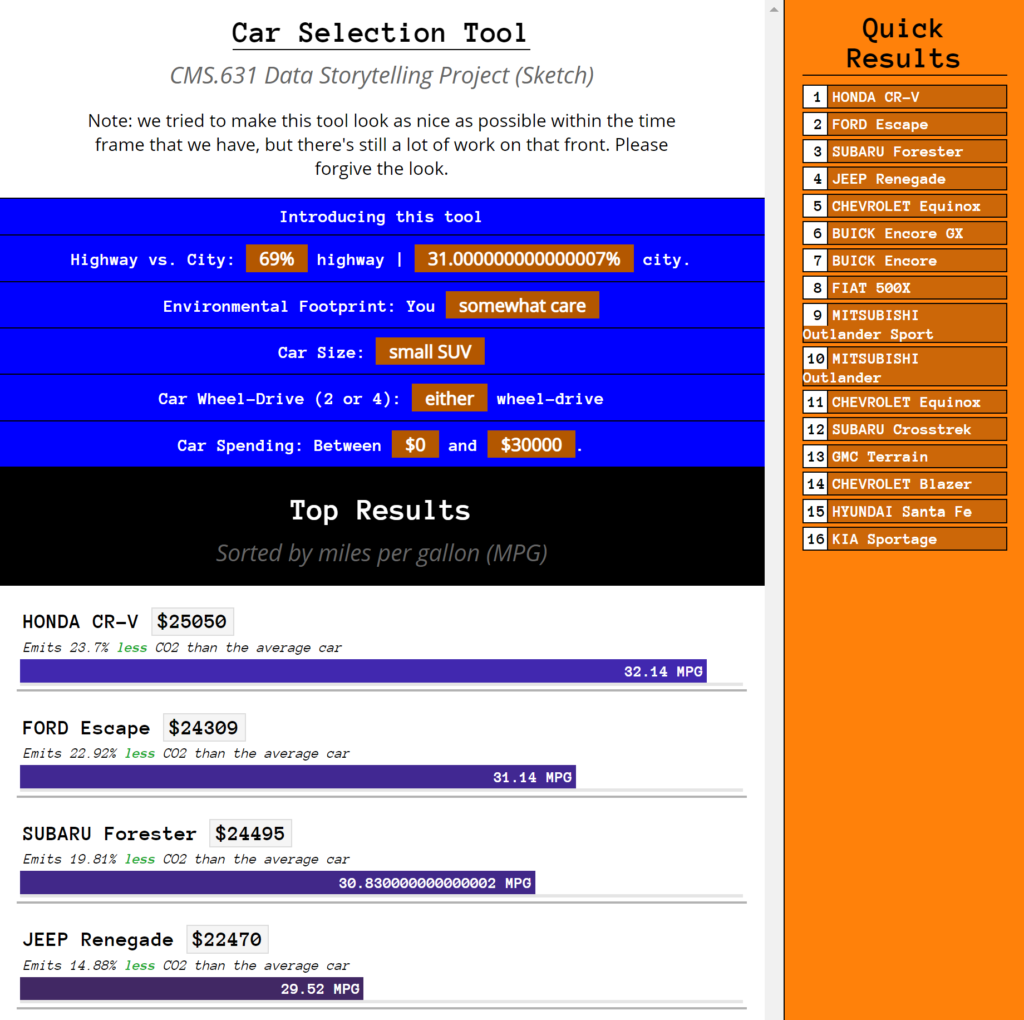
              In our previous project, Fernanda Ferreira, Tyler Millis, and Robert M. Vunabandi created a tool to narrow down car choices based on user preferences. You can find more information in our previous blog post linked here and see our original tool pictured below.

Current Project

              Based on the feedback from last time, we overhauled the tool to make it easier to use and the results clearer. This involved walking the user through each preference and then showing the results both on the side and then as a bar graph below. Since we asked the user about their care for the environment and we wanted to make sure to highlight that in the results, we also now show how each car’s pollution relates to the average car’s pollution in order to give some reference. We also simplified the charts below our tool so it now details two environmental scores against car price instead of various charts with multiple encodings.

              Our audience for this tool was anyone looking to purchase a car. We envisioned this tool being useful whether you were anyone first-time buyer to a car enthusiast. Ideally, this tool would be used to help someone narrow down which cars they may want to purchase, but if they’ve already selected a few cars and were looking for detailed information, this tool might not be enough for them.

              We wanted to test two different types of goals. First, we wanted to test whether our tool made an impact on the user, such as increasing their knowledge on cars or making them think more about which factors they consider when buying a car. Second, we wanted to test the effectiveness of our tool, such as the ability to help users narrow down cars to buy or providing enough information to help them choose a vehicle. In order to test these goals, we created a survey where users would answer questions before viewing the tool and then see how their answers changed after the survey, as well as evaluating the tool generally. We initially planned to roll this survey out in the Class of 2020 Facebook page since a lot of students may be looking to buy cars soon, but realized such a post wouldn’t match the climate of posts happening currently. Instead we reached out to a variety of friends and family, some of whom are thinking of buying a car soon.

              You can view our tool here.

Feedback

              Our tool seemed to meet our goals, but there is room for improvement. For each of our questions on our survey, we used a 1 through 5 scale, with 1 being more negative, such as “Strongly Disagree,” and 5 being more positive, such as “Strongly Agree.” From our survey, we found that roughly a third of respondents’ understanding of cars increased by one point with the rest staying the same. Forty percent of users felt more confident in the factors they would consider when choosing which vehicle to buy, with an increase in anywhere from one to three points. Roughly twenty percent of respondents had an increased knowledge on cars’ impact on the environment after using the tool, whereas thirty percent felt their understanding had decreased. This was interesting to see, that users felt their understanding had decreased, but it is possible we made them question what they knew about the topic, otherwise we need to make our tool clearer in regards to the environment. In general, users found the tool helpful, thought it had the information to help them choose a vehicle, and thought it was effective, with only a few feeling more neutral or enthusiastic about these metrics.

              We also asked our testers about additional information we could provide in the tool and other changes we could make to make it more effective. Eighty percent of users offered additional metrics for cars that would be helpful. These included various features, such as safety, reliability, acceleration, pictures, used versus new, ratings, and more. Unfortunately, most of these were not offered in the data we were working with, but we agree that most of these would be useful to show, but we’d have to think more deeply about how to show so much data without overwhelming the user. Beyond these features, users also thought the UI could use some work. Some users found the colors and result updates distracting, whereas others thought the tool should be more mobile friendly. Some testers also thought that the graphs were intimidating or could use better transitioning, so we might want to think about how we can better simplify these graphs, provide other ways to show the data, or lead into the graphs better.

              Overall, we seemed to meet our goals of creating an effective tool and increasing user understanding of the material in our tool, but there is a variety of places we could work on to optimize these goals.

Feel Your Car’s Pollution

Using data for vehicles from the U.S. Department of Energy’s Fuel Economy measurements, I created a data sculpture to show the effect of air pollution on people’s vehicles.

Steve’s Chrysler has an air pollution score of 3, so he is wearing a bandana

In order to present this data, I used different masks to restrict breathing that aligned with a vehicle’s air pollution score. The worse the car’s air pollution, the more restrictive the mask would be. The rating is on a scale from 1-10, (with the higher rating meaning less air pollution from the vehicle) so a rating of 10 would have no mask at all as compared to a 1 having a heavy duty mask. The reason why the mask is used to represent the air pollution score is so that way people would have more trouble breathing naturally, which would happen with more and more air pollution.

This would ideally be part of an exhibit, where people who take part are given a mask that corresponds with the rating of the vehicle they arrived in to the exhibit. They would have to walk around the exhibit, constantly aware of the toll their car is having on the environment. For a less active experience, this sculpture could be more static in an exhibit, showing what different masks would look like next to various types of vehicles.

Sandy’s Dodge has an air pollution score of 1, so she is wearing a more restrictive mask

Tyler’s Data Log – February 22

Chatting with People

On this day, I used Messenger and Snapchat to communicate with others. I mainly messaged about what I was doing that day, both with pictures on Snapchat to my friends or message updates to my girlfriend on what I was doing and when I would be back. My snaps could locate me at MacGregor, at Boda Borg, and the place I went to dinner at. If someone wanted to, they could easily trace what I did that day just through my messages and snaps.

Moving Around Town

I stayed in my dorm until around 2:30, during which the security cameras could have caught me leaving. I walked to the Kendall T station, in which I used my MIT ID to pay the fare. I rode to Downtown Crossing and transferred to the Orange Line, riding until Malden Center. I walked to Boda Borg, in which I used a signed electronic waiver, once again marking my location. Afterwards, I had dinner at a nearby Asian restaurant, in which I used my debit card. I then traced my steps back to MacGregor, once again using my MIT ID to pay the fare at Malden Center. My day ended with me tapping into MacGregor, once again signaling my location.

Getting Online

I browsed Facebook throughout the day for roughly twenty minutes. I scrolled through various posts and some comment sections, but never liked or reacted to anything. I also played a game on my phone, Hearthstone, for about an hour online with random people, but with no communication to them.

Other Things

My phone likely tracked my location, at least while I had it on briefly when looking for food places after Boda Borg. Who knows how many cameras I passed throughout the day who could have identified me if needed.

Effects of Hydraulic Fracturing on Groundwater Contamination

              I recently watched two students present on their findings in their UROP this IAP. Their project was in relation to contamination of groundwater in Ohio due to hydraulic fracturing. They showed not only the data, but the process for gathering that data and discussions of the impact of that data.  They specifically show the amount of gasoline range organic (GRO) and diesel range organic (DRO) compounds for given locations around Ohio in relation to gas wells and drinking water wells. They also graph how the amount of DRO and GRO compounds change based on distance (distance to the closest gas well, but I’m not sure).

              Since this presentation was given at an event for multiple UROP students to show their findings, I believe the audience is supposed to be MIT students and faculty from any department. I imagine they created the presentation for the express purpose of explaining the process and results of their research. It seemed that the data did not match their expected results, so they leave the data open to discussion, to talk about errors in the process or ways to rethink the analysis of the data.

              I did not find that the way the data was presented was effective. I think the process was carried out right, but the data visualizations were hard to follow and gather results from. With the separation of the three maps, it was hard to really tell how each data point related to placement of gas and water wells. The presentation did not compare the data to what non-contaminated groundwater would look like either. Putting the data into more context within the data visualizations would have been more effective.