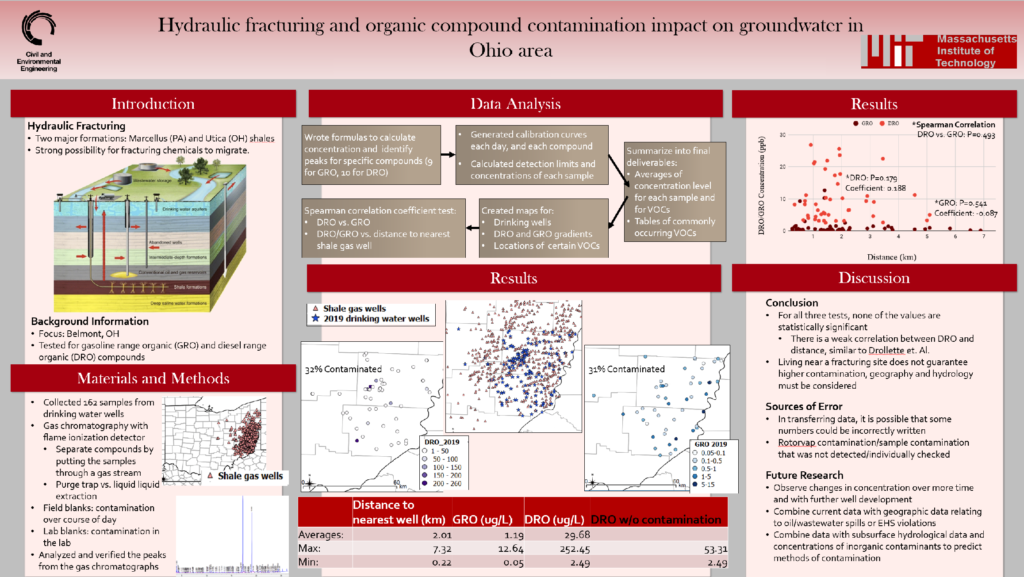
I recently watched two students present on their findings in their UROP this IAP. Their project was in relation to contamination of groundwater in Ohio due to hydraulic fracturing. They showed not only the data, but the process for gathering that data and discussions of the impact of that data. They specifically show the amount of gasoline range organic (GRO) and diesel range organic (DRO) compounds for given locations around Ohio in relation to gas wells and drinking water wells. They also graph how the amount of DRO and GRO compounds change based on distance (distance to the closest gas well, but I’m not sure).
Since this presentation was given at an event for multiple UROP students to show their findings, I believe the audience is supposed to be MIT students and faculty from any department. I imagine they created the presentation for the express purpose of explaining the process and results of their research. It seemed that the data did not match their expected results, so they leave the data open to discussion, to talk about errors in the process or ways to rethink the analysis of the data.
I did not find that the way the data was presented was effective. I think the process was carried out right, but the data visualizations were hard to follow and gather results from. With the separation of the three maps, it was hard to really tell how each data point related to placement of gas and water wells. The presentation did not compare the data to what non-contaminated groundwater would look like either. Putting the data into more context within the data visualizations would have been more effective.
