Honeybee Population Decline

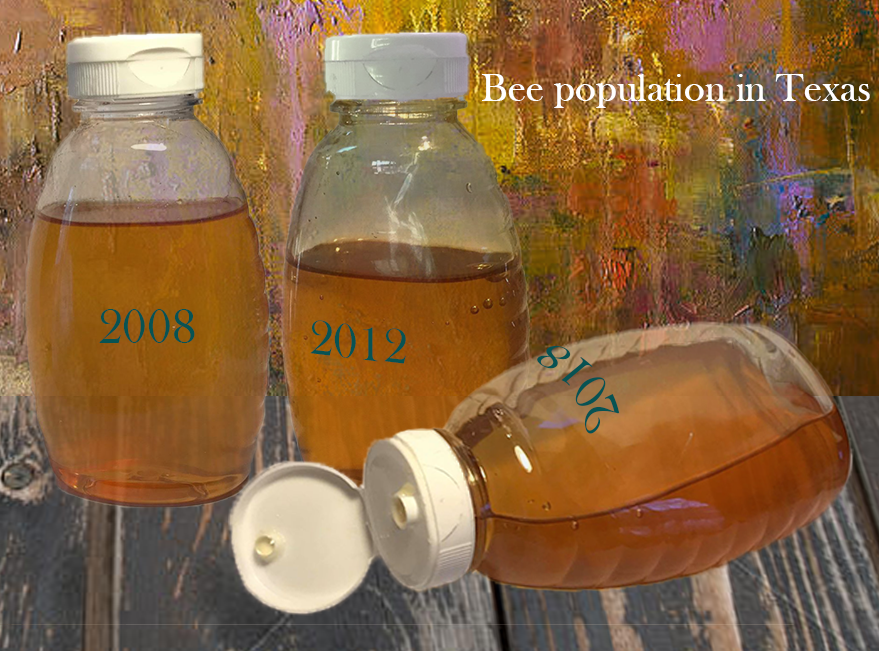
For my data sculpture I looked back at my project 3, in which we explored the honeybee data set. I was particularly struck by the “loss data,” which mapped the percentage of colonies that died off per year in each state. From our project I knew that over time the amount of honeybees dying every year has steadily increased, so I checked around the data to find a state that showed a particularly drastic increase in colony loss while also hosting a large amount of colonies. Lo and behold, Texas met these criteria.

I had a bottle of honey lying around (from a beekeeper friend back in Boston!) so I used the amount of honey left in the bottle to represent the amount of bees that survived each year. While this particular metric is fairly ambiguous and can’t necessarily be gleaned just from looking at the graphic, I feel like the overall narrative that bees are dying at an alarming rate is still conveyed.

After taking the three pictures of the honey I just threw them in Photoshop. I’m not particularly happy with the background and labels but I struggled to find ways to improve them without making the picture needlessly complicated. For instance, I thought about putting the actual loss percentages on each bottle along with the year, but without a text explanation of what the percentage means it was not very powerful. In the end I decided this simple design worked best.

Data Diary

Chatting with People

The majority of my interpersonal communication takes place via gmail, Facebook messenger, and Slack. A couple of days ago I read that Facebook has started fully encrypting their messages, so I guess there is no way that could be used as a data set. In the evening I had a conversation with a friend that I’m sure was picked up by their Amazon Echo. I also intermittently messaged friends via Signal throughout the day, an app we use specifically because it does not retain any information on sent messages.

Moving Around Town

I started the day by tapping my van into the MIT commuter lot by Simmons. From there I tapped into the Z Center for a workout before heading into lab (which was definitely caught on security cameras). I didn’t leave the lab for seven or eight hours, but I filled my water bottle several times at one of those smart water fountains that tracks water usage. I also took pictures and videos of my work throughout the day which includes time and location metadata. In the evening I went to work in Darwin’s Coffeeshop, where I was recorded on CCTV and I made a credit card purchase. I also logged onto the Darwin’s WiFi.

Getting Online

The non-communication websites I visited today are Reddit, Instagram, YouTube, Google Drive, Dropbox, and the Solidworks Forums (all of which I have personal accounts with, allowing them to track what I view). I played some video games through the Steam App, watched some Netflix, and used the streaming services Spotify, Soundcloud, and Apple Podcasts. Can’t miss a single minute of NPR! I also logged onto the Data Storytelling Studio website 🙂

Other Breadcrumbs

I used Venmo to pay my rent this morning, filled out my absentee ballot (which is not yet online data but soon will be), and operated a 3D-printer that was connected to the internet. Finally, I signed off for a friend’s package with UPS so in a way I gave my data fingerprint (but I would argue that since I signed my friend’s name I did not really reveal anything about myself).

Discarded Needles Around Boston

https://bostonopioid.github.io/discarded-needle/index.html

I first explored Discarded Needles last year, and since then its impact has stayed with me and to an extent changed how I view the city of Boston. It combines its primary dataset with a series of gripping interviews and images that really enhance the entire narrative. All in all, I believe this is an excellent example of data storytelling.

The story aims to examine the rise of the opiate crisis in Boston using the dataset of citizen reports of needles on the ground. I imagine this data was taken from the local 311 office, and perhaps it could be taken through the Freedom of Information Act. The story opens with the total amount of needles reported in large bold letters, a staggering amount that draws in the reader.

From here, the writers weave together several interviews alongside heavier data analysis to weave their story.

This bar graph does alright at showing the magnitude of the problem over time, but I think even more revealing is when each data point is laid over the city of Boston based on time and geographic location.

Apart from the data, the background of the story is filled with pictures of needles found around Boston, decrepit areas, and other elements of the issue. The most pivotal piece of media in this story is the final picture, drawn by a first grader talking about the needles they find around their school. 

I believe the goal of this story is to highlight the opioid epidemic in and around Boston, an issue that is obviously heavily affecting the whole nation but can be completely overlooked locally by Boston residents (as in my case). The writers do not assert a path forward or lay out clear next steps, instead they include many instances where the volunteers and people currently involved feel futile and ignored by the local government. In this way, I believe this piece is also designed to raise awareness of the government’s apathy toward this subject. I believe the audience for this piece is local Bostonians. Many of the locations, including “Methadone Mile,” “the Long Island Recovery Center,” and “the Orchard Garden School” are not explained in a way that would give context to those outside Boston. On top of this, the lack of a real call to action at the end of the story reveals that the authors intended for this story to make an impact on the local level rather than a national one.