Keep calm and drink more wine, unless you can’t!

The idea of this sculpture is to map the effect of climate change of wine production. The medium is a video in a wine store or a restaurant and the audience is people who visit this establishment. The goal of this video is to make people, who love wine aware of the fact that they might not have their favorite wine a few years down the line and encourage them to donate to causes which are fighting climate change.

As the average temperature has increased in the past half century viticulturists today are forced to harvest the grape crop much earlier than the ones from two generations ago did. It’s all good and well today because the grape crop is still being produced but there’s a scare that with increasing summer temperatures, in the distant future, regions around the world which are known for their wine won’t be able to produce any grape crop. One such region is Bordeaux!

Viticulturists from Europe have maintained logs of harvest dates for the past 650 years [1]. A simple scatter plot shows that as the average summer temperature increases the harvest date gets nearer to August 31 (number of days for harvest after August 31 is used as a standard measure in this industry).
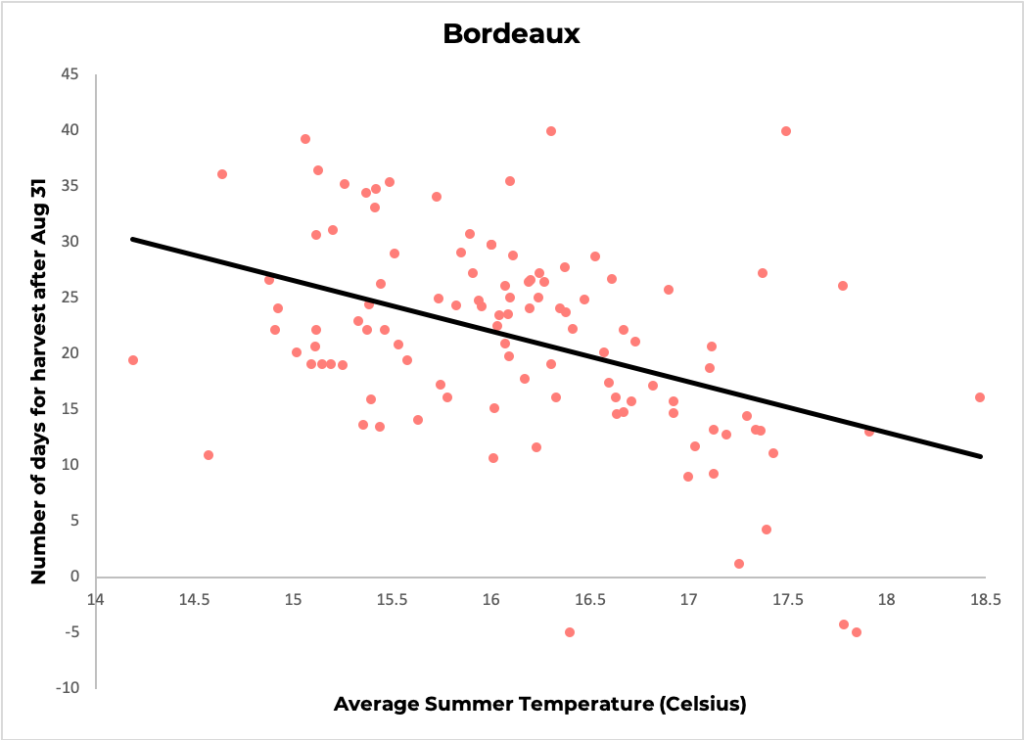
I used wine itself to represent this trend. The amount of wine in the glass is indicative of the harvest date. More the wine later the harvest date (which is better) and lesser the wine earlier the harvest date (which is bad).

The sketch below shows this trend for 4 different cases (values are averaged over 10 years to smoothen the values).

After showcasing this trend, the audience sees another glass which is empty. This represents the future, where the average summer temperatures have made it impossible to produce wine in Bordeaux (the data here is just a guess and lacks scientific backing). The audience will be asked to take an action (donate to a cause which fights climate change).

References:
[1] Daux, V., I. Garcia de Cortazar-Atauri, P. Yiou, I. Chuine, E. Garnier, E. Le Roy Ladurie, O. Mestre, and J. Tardaguila. 2011. An open-database of Grape Harvest dates for climate research: data description and quality assessment. Climate of the Past, Vol. 8, pp. 1403-1418, 2012 www.clim-past.net/8/1403/2012/ doi:10.5194/cp-8-1403-2012

Neil’s Data Log (2/24)

Chatting with people

I have a very sick (not in the cool way) morning ritual. Every day literally starts with me snoozing the alarm and then checking my notifications for any messages which popped up during the night (people who come from places halfway across the earth will empathise with me)!

I use quite a few applications to chat with people. People back in India prefer using WhatsApp. Friends and classmates here in the US prefer Slack and Facebook messenger. Instagram messaging is mostly for sharing memes and funny videos (but it counts, right? Because the memes people share can say a lot about them :P). Emails (outlook and gmail) and LinkedIn is reserved for professional conversations. Also, does piazza count?

Moving around

The weather was amazing today and I decided to bike to school instead of taking the bus. I used Bluebikes twice today and it collects information about the start station, end station, start time, end time, etc.

I used my credit card a couple of times today, to buy a coffee and later a candy bar in a vending machine. So my credit card company probably knows exactly how much calories I gained in that delicious smoked butterscotch latte!

I also used the WiFi at MIT and later in the cafe. And my data is always on! I guess all of these people could track my location while I was connected to their network.

Getting Online

I listen to a lot of music. I was shocked when Spotify released the amount of music I had heard in 2019. It was around 60k minutes! Spotify is probably my most used application and it collects a lot of information on me!

I use Instagram and like every 20 something person I’m sorta addicted to it. I use Facebook too, but not as much as I used to use it 5 years ago. I spent a lot of time today on Stack Overflow searching for some python and R things that were hindering me from completing a few homework.

I also use Amazon Fresh, but today wasn’t groceries day! But I did use Amazon to search for a shiba inu plush and a giant Hershey bar!

Other breadcrumbs

I don’t use much Twitter, but today was a special day. Trump is visiting India and he made some hilarious pronunciations (or rather mispronunciations) of some Indian names during his rally. Indian Twitter is lit up with memes and videos and I spent a good half an hour laughing!

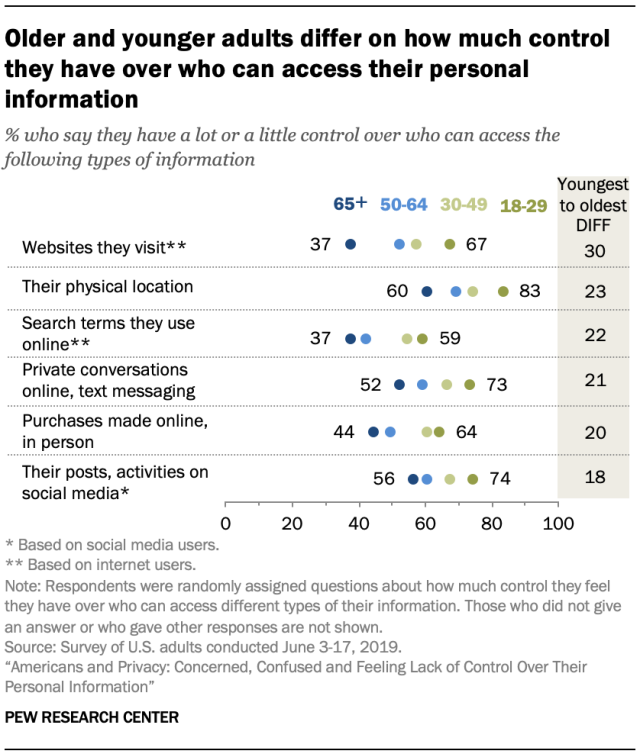
Data privacy: Boomers v. Millennials

Source: Pew Research Center

This data presentation is about what people belonging to different age groups have to say about how much control they have over who can access their personal information. It has been taken from a survey of US adults conducted by Pew Research Center in 2019. 

The wordings used are not too domain specific and are easy to follow. This data presentation is intended for those who are interested to know more about where people stand when it comes to data privacy.

The goal of this presentation is to outline that older and younger people differ when asked about how much control they have over who can access their personal information. The people belonging to 65+ age group feel that they have little control, while people belonging to the 18-29 age group feel relatively more in control.  

The choice of using the different data categories on the y-axis makes the graph more readable. The point that the author wants to make is highlighted in the heading, which makes it very clear. The column in the gray which gives the difference between the youngest and the oldest age groups is very instrumental in backing the point made at the top. 

The presentation is effective but it can be improved further. Instead of using points, if a multi-category bar chart was used, it would make the graph easier to read. This would also eliminate the need of the column on the right. Additionally, the X-axis scale is a bit confusing. It hasn’t been clearly mentioned if the scale indicates the percentage of people who say or the percentage of people who say they don’t have control over who can access their data.