Source: Pew Research Center
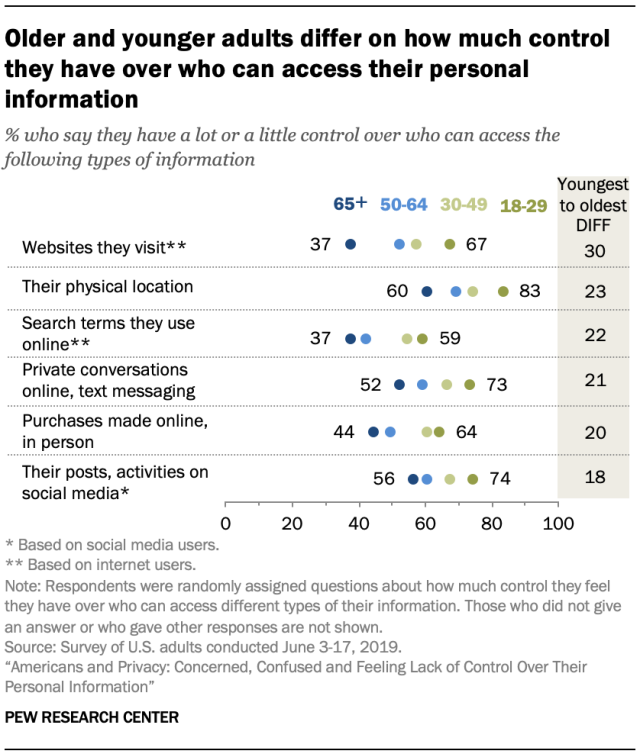
This data presentation is about what people belonging to different age groups have to say about how much control they have over who can access their personal information. It has been taken from a survey of US adults conducted by Pew Research Center in 2019.
The wordings used are not too domain specific and are easy to follow. This data presentation is intended for those who are interested to know more about where people stand when it comes to data privacy.
The goal of this presentation is to outline that older and younger people differ when asked about how much control they have over who can access their personal information. The people belonging to 65+ age group feel that they have little control, while people belonging to the 18-29 age group feel relatively more in control.
The choice of using the different data categories on the y-axis makes the graph more readable. The point that the author wants to make is highlighted in the heading, which makes it very clear. The column in the gray which gives the difference between the youngest and the oldest age groups is very instrumental in backing the point made at the top.
The presentation is effective but it can be improved further. Instead of using points, if a multi-category bar chart was used, it would make the graph easier to read. This would also eliminate the need of the column on the right. Additionally, the X-axis scale is a bit confusing. It hasn’t been clearly mentioned if the scale indicates the percentage of people who say or the percentage of people who say they don’t have control over who can access their data.