Climate change threatening wine

Sule Kahraman

Grape Harvest Volume in France by Century

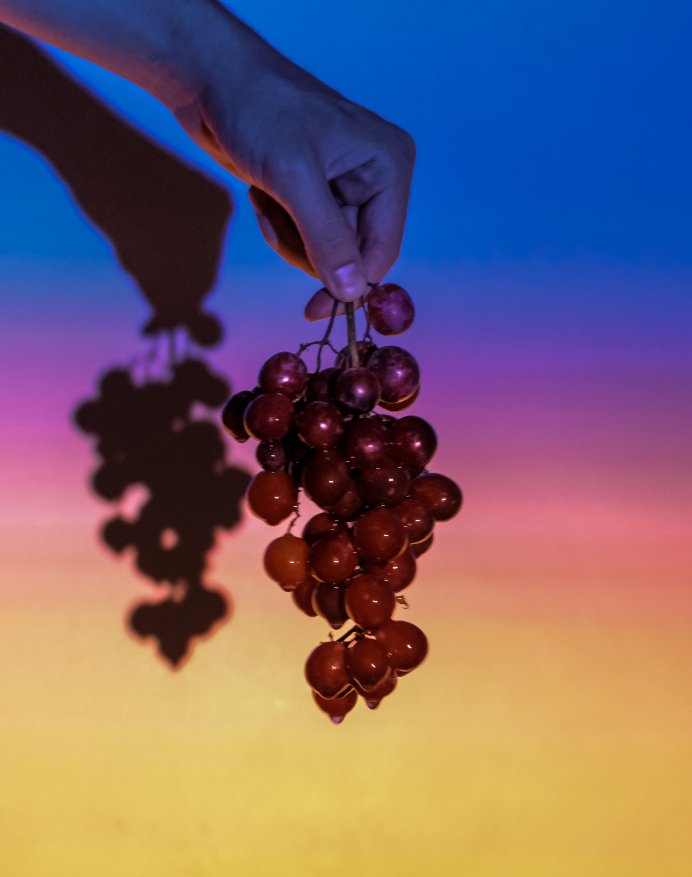
For my data sculpture I chose to work with Grape Harvest Dataset https://www.ncdc.noaa.gov/paleo-search/study/13194 because I had a few wine bottles laying around.

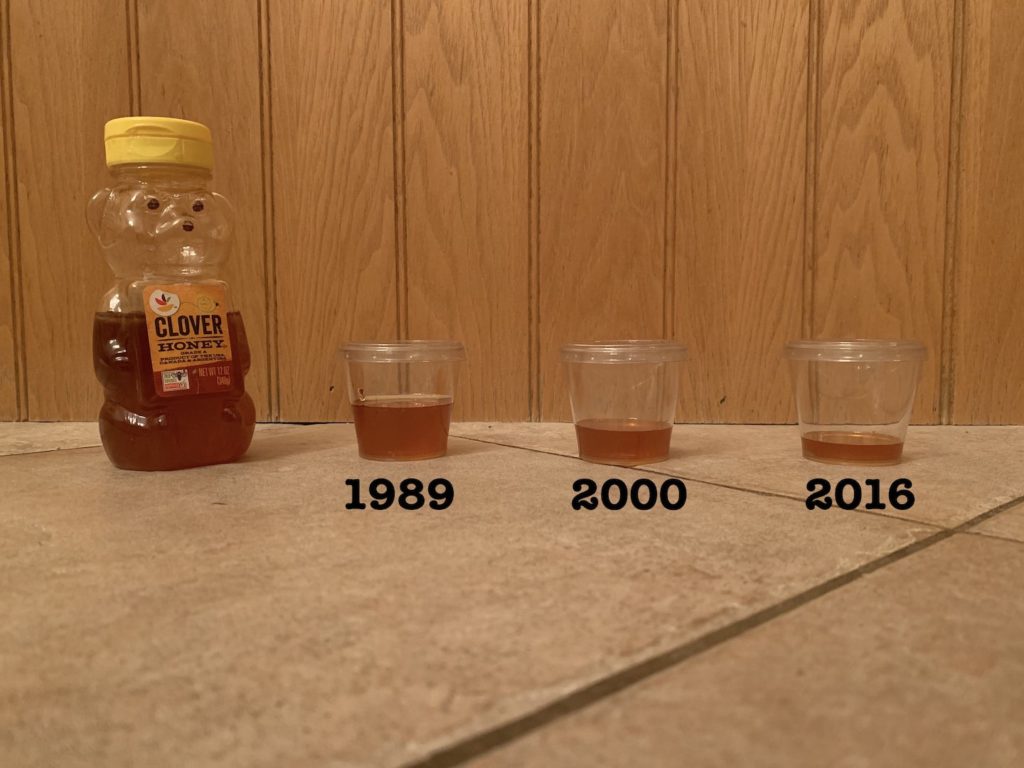
In this sculpture I try to represent the change in the rate of grape harvest in France, hence I used only the French bottles. The number of bottles for each century maps to the grape harvest volume in that century. I chose to represent the future with a wine glass that has very little amount of wine in it to highlight the magnitude of the threat and to draw attention to the urgency of the matter.

No More Honey

-Sarah Mousa

I was inspired by the bee dataset and chose three data points tied to bee colonies from the state of California from 1989; 2000; and 2016. These three data points show a drop in bee colonies, by 30% from 1989 to 2000 and by 50% from 1989 to 2016.

Description:

I used honey (a product of bees) to demonstrate the proportion drop in bee colonies (in this case, in the state of California for abovementioned years); the use of honey is a way to make the issue more tangible to people (an alternative I was considering was showing a rise in cost of honey to indicate decreasing supply).

Audience:

The honey in jars shows clear decrease that is easy to grasp for a wide age range. It is intended as a trigger for a wider audience, to inspire them to do their research on what is causing drops in bees, and what can be done about it.

Sickly wine

I used the grape vine as a sculpture of the geographic story about how climate change has affected wine. I tried to incorporate three senses (taste, touch, sight) to capture more of the data.

Taste: I poked holes in the grapes on the bottom of the vine and soaked the grapes in a sugary solution for a couple of hours. After this, the grapes on the bottom were significantly sweeter (disgustingly so) than the non-soaked grapes at the top.

Touch: because of the high concentration of the sugary solution, the grapes at the bottom were much softer and felt wilted. This fit in with the concept that grapes are ripening faster on the vine and going bad in the heat. In addition, the grapes were sticky and really unpleasant to the touch.

Sight: I wanted to communicate how heat was changing the taste of the grapes, so I created a gradient of hot to cold (orange to blue).

In the end, the grapes near the top were more desirable, showing that wine growing regions are moving north.

Branching Out

For this sculpture, I revisited our first sketch (  https://datastudio2020.datatherapy.org/2020/03/05/the-city-in-bloom/ )

The sculpture attempts to be an approximation of a tree, where the different branches are all the different trees that are in bloom in a neighborhood right now. Larger branches correspond to a larger population of trees (in this sketch, the white flowers have the largest branch), and the number of branching moments corresponds to the number of tree species that fit in that category of flower color.

In pursuing high fidelity in terms of materials, I ended up a little limited in palette (also, I should clarify — these are all fallen branches, no trees were harmed!)

Data: 2015 data from the NYC Tree Census from the NYC Parks Department.  ++ information on tree flower colors

Trees in NYC: School Art Project

For this sketch, I created wire sculptures to represent the proportion of trees in New York City that are in good health. These wire sculpture kits would be handed out to students in a New York City elementary school art class, with 80% of the students with materials to create a healthy tree (green tree), and 20% of the students with materials create an unhealthy tree (brown tree). The idea is that after students notice that not everyone has the same wire tree kit, there would be discussion and dialogue about the health of trees in New York and how students can get involved. The handout created in a previous sketch (pictured below) would then be distributed to students.

Dataset: https://data.cityofnewyork.us/Environment/2015-Street-Tree-Census-Tree-Data/pi5s-9p35