Trees In NYC: Sign Up To Help!

By: Claudia Chen, Eileen Hu, and Thiago Medaglia

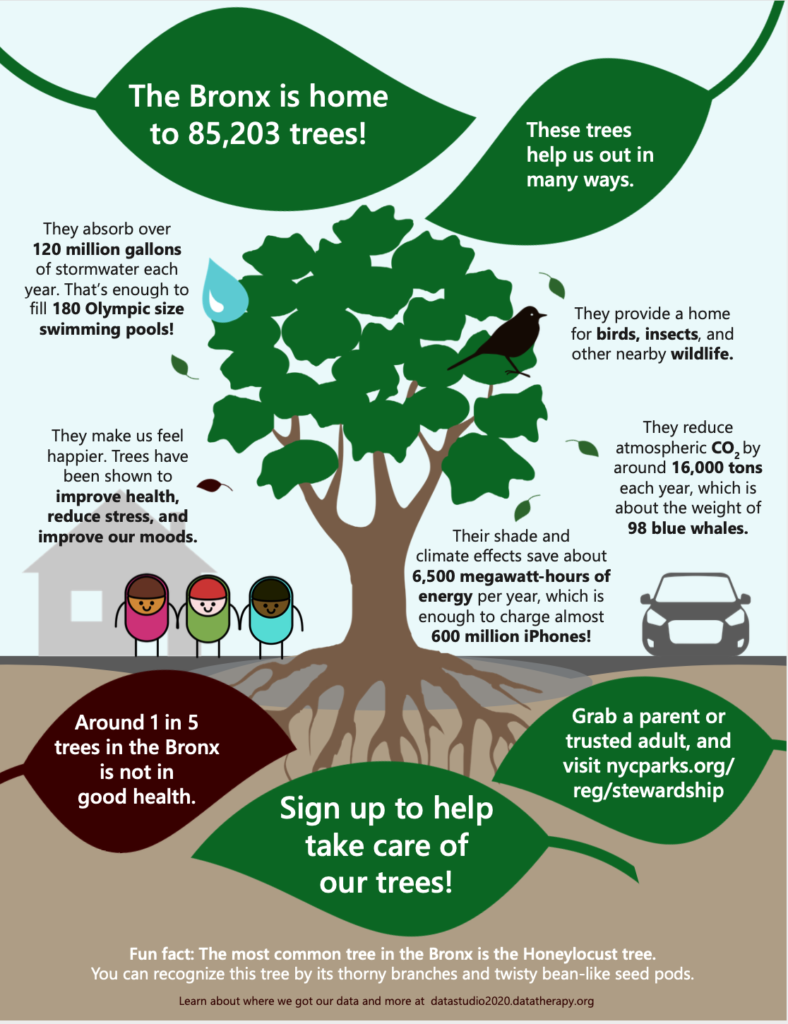
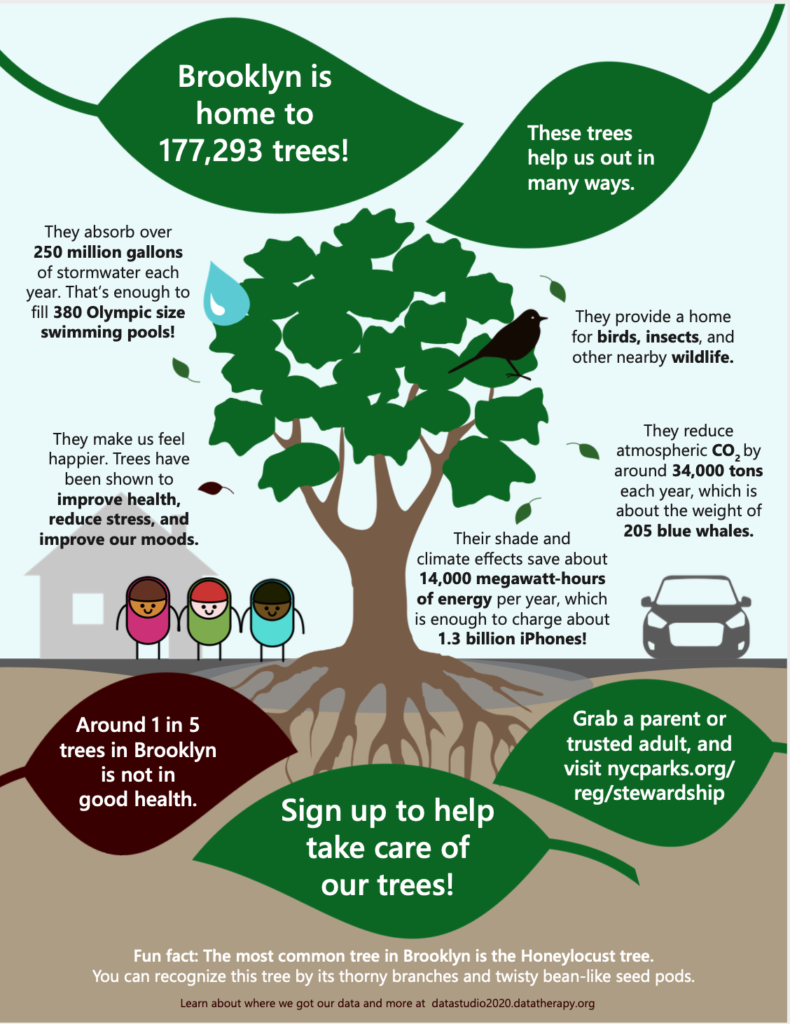
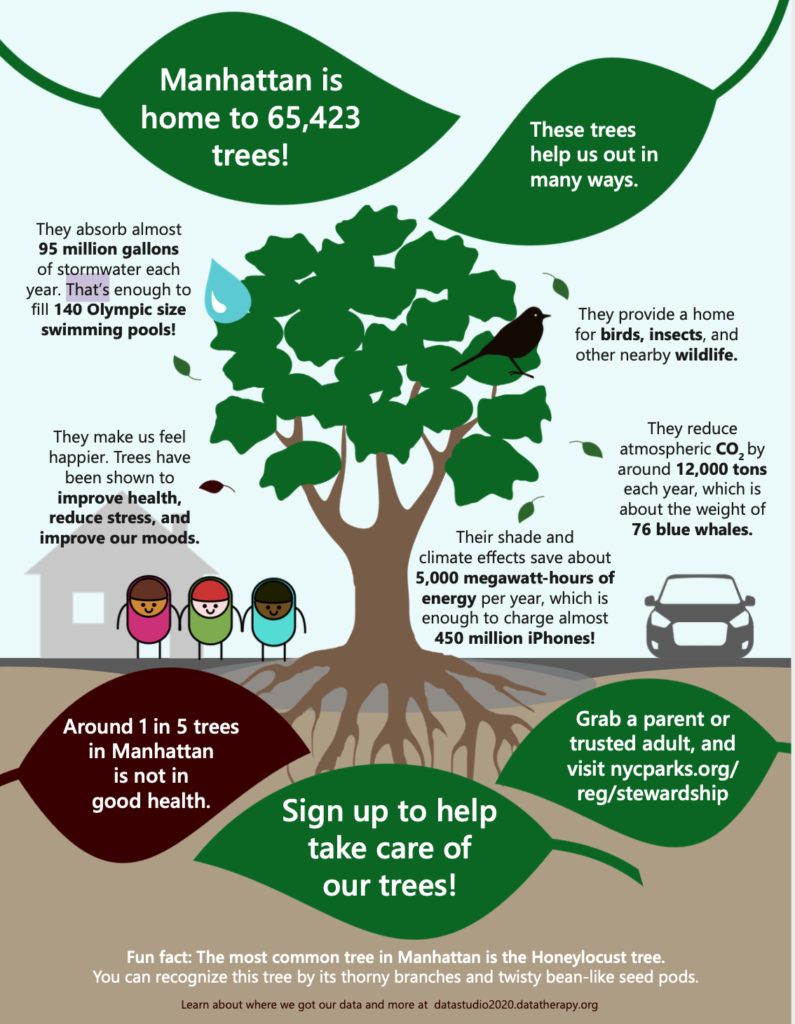
The data say around 1 in 5 street trees in New York are in “fair” or “poor” condition (as opposed to “good” condition). We want to tell this story because children in the area can help improve these tree conditions by getting involved. We’ve chosen to tailor our message to middle school students in New York City in the form of a handout for them to take home. Information on the handout is tailored to each of 5 boroughs of NYC, with the goal of personalizing the graphic and allowing readers to see themselves in the data. With this, we hope students will sign up to help volunteer and improve tree conditions in NYC.

We started out by analyzing the 2015 NYC street tree census, which showed us how many street trees there are in NYC and the distribution across boroughs. The data also showed us that about 17% of trees (in NYC overall and in each borough) were evaluated as having fair or poor health (rather than good health). It also had a limited amount of data on the estimated number of stewards per tree which led us to the city’s Citizen Stewardship Program that encourages people to volunteer to care for, plant and learn about trees. We decided to tell the story of how trees help us and how we can help trees, from the perspective of the NYC Parks & Recreation Department.

This led us to look for data regarding tree impact in the city. Impact for each individual tree varies depending on tree species/maturity and there was no data available regarding total benefits for the current street trees in NYC by borough. However, we were able to find a dataset analyzing total benefits of street trees from 2005 data with detailed models. We used these total benefits and the total number of trees at the time to get the approximate average benefit per NYC street tree. Then we multiplied those averages by the actual number of trees in each borough and rounded the numbers to make them approachable. Finally, we contextualized the numbers using familiar objects, for example, converting megawatt hours to the number of fully charged iPhones. 

For this project, we paid more attention to the question of how to represent the benefits accurately and to make them more personal in terms of presentation rather than looking for surprising patterns within the original dataset. This led to some interesting challenges. We had to make choices regarding how much it was acceptable to round the numbers and what comparisons to make. For example, for “trees reduce CO2 by around x tons per each year”, we were considering using “x miles of car CO2 emissions” or “offsetting CO2 emissions from driving from the earth to the moon x times” rather than “weight of x blue whales”. We thought about how we wanted to represent the diversity of the city when putting in figures for the kids. We had to figure out how to balance putting in the cool facts we found vs keeping the infographic from getting cluttered. However, the whole process was instructive and interesting, and we even got to add in some symbolism with the idea of “1 in 5 trees is not in good health,” indicated by a dark brown leaf for every 1 in 5 leaves on the infographic. The smaller leaves were also designed to lead the reader through the infographic, pointing to the specific facts to read.

Sources

Specific borough and tree condition data:

https://data.cityofnewyork.us/Environment/2015-Street-Tree-Census-Tree-Data/pi5s-9p35

Impact per tree:

https://www.milliontreesnyc.org/downloads/pdf/nyc_mfra.pdf

Happiness from trees:

https://greatergood.berkeley.edu/article/item/why_trees_can_make_you_happier

Context conversions: 

https://www.livestrong.com/article/350103-measurements-for-an-olympic-size-swimming-pool/

https://en.wikipedia.org/wiki/Blue_whale

https://www.epa.gov/greenvehicles/greenhouse-gas-emissions-typical-passenger-vehicle

https://blogs.oracle.com/utilities/iphone-6-charging-47-cents

Thiago’s Data Diary


Apps often save data about all your activity. Which apps did you use?
Audible, Twitter, Facebook, Instagram, Safari, WhatsApp, Telegram, BlueBike, Netflix, Marvel (game app).


Moving Around Town
Using a credit card, T pass or library card creates data and security cameras track your location. Where did you go and what did you do?

T: From Porter Square to Kendall (morning); BlueBike: From Kendall to Porter evening).


Getting Online
Games and websites log your activity. What did you do online?

Read the news in Safari, followed my twitter feed, watched Netflix, played with a game app (Marvel).

Other Things
What other data breadcrumbs did you leave behind during your day?

I’d say that my email activity


Neha’s Data Log 2/23

Chatting With People

I had two long phone calls on Sunday. First, with my dad and then with a friend. The phone call with the friend was made over WhatsApp. In addition to speaking on the phone, I used iMessage and WhatsApp to chat communicate with a total of 9 people.

Moving Around Town

I took a long walk with a friend on Sunday morning–the weather was fantastic! We walked from my house in Somerville to Bagelsaurus where I used my credit card to purchase an Everything Bagel. We then walked down to Harvard Square and towards the Mt. Auburn area. There, I made a stop at Darwins to purchase a coffee with my credit card. While walking, my internet remained connected to my Verizon data. We then walked along the Charles and finally looped back to my house in Somerville. After the walk, I did not leave my house that day.

Getting Online

I spent a considerable amount of time on the internet. I had to write a policy memo for another class, and needed to research the impact of climate change on water infrastructure in Chennai. I browsed through news publications (NPR, Washington Post, Caravan, Scroll, NYT, The Hindu, Times of India, etc). I also browsed publications from the OECD, World Bank, Observer Research Foundation, and USAID. I logged into the MIT library network to pursue academic articles, Stella and Harvard Canvas to check on other assignments. I typically do my writing on google docs, so I was also logged into my google account. While procrastinating on my research and writing, I watched a few episodes of Veep on Amazon Prime, browsed through Instagram, and Facebook. I also listened to a few live musical performances on YouTube.

Other Things

Since I didn’t leave the house, other then to take a walk, I don’t think I left as much of a data trail as I normally would have. I am careless about closing apps on my phone, and typically have WhatsApp, Instagram, FB Messenger, Safari, Gmail, Google Calendar, Google Maps, and Blue Bike on in the background. I imagine that though not in use, they might be passively collecting my location data.

Data Log – Ifeoluwapo Ademolu-Odeneye

I started my day in the Student Center, as I worked there overnight Sunday. The study space has tap access so every time I used the bathroom or filled up my water bottle I would use my ID giving location data and information about the usage of the space.

I bought a plane ticket. This is notoriously a process that takes a lot of data using cookies. I also bought this ticket after monitoring a price tracker with alerts for the last two months and waiting for the price to drop. I bought the ticket after receiving an alert e-mail and following the link in the e-mail so there is data given to google about how successful this service is. I also used my credit card to buy the ticket.

P-set printing, using the Athena system and my MIT ID

Overleaf – Writing in LaTex on an online editor meant constant data transfer. I also continually used google for help with the project I was working on.
Google Photos – I take pictures of notes etc. Google Photos has a feature that allows you to search your own photos using tags that they have given it using AI/Machine Learning. I would search my photos for words like “blackboard” to filter to the photos I had taken in class. When you make these searches the algorithm improves by looking at what you click after the search is completed.

I went to Dunkin to buy a bagel – used a debit card

While working, I used my phone continually. I would check my phone, group.me, Instagram, text, Snapchat – on all these apps they collect data on how long I use the app which buttons I press what I like what I don’t like.

Walked back to my dorm where I use my MIT ID to gain access.

Youtube – I use youtube to watch “comedy bites” – clips from tv shows compiled into smaller chunks because I don’t have time. Youtube is collecting data on what videos I watch all the way through vs when I choose another. They collect data on how long I watch an advert before I click “Skip Add”. They also let you up/down vote on adds to collect data on what you do and don’t like. I don’t click these but even refusing to participate is data.

I then went to class – I use paper to take notes so no data there but I do check my phone during class so the previous discussion continues

I attending a 6.036 (Intro to Machine Learning) LA meeting. Used Google Docs to give feedback on homework. I then helped at office hours for 6.036. There is a queue system where people go online ask for help and then I click a button to say I am currently giving them help. This collects data on how many people I help and how long it takes me to help a student. I also use a google form to check in and tell the staff that I turned up for my shift. We also use an online code editor which collects information on usage

I reported my weekly worked hours on ATLAS so I can get paid.

Online CrossWord Solving with friends – timing how long it takes me to complete the crossword.

In addition, Google Maps creates a map of where I’ve walked however I chose to not include this here for safety.

Josh’s Data Log

Chatting With People
I used a variety of apps throughout the day that recorded data on me in a variety of mediums. When I woke up, I spent time on Twitter and Facebook – not commenting, just scrolling. I accessed these sites through Chrome, so Google also had access to this behaviour. In addition to social media, I sent iMessages, texts, and had phone calls and a FaceTime video call. I took a flight in the middle of the day, so my lack of internet connectivity for this period would almost certainly show up in social media activity logs.

Moving Around Town
My mobility patterns were a bit out of the ordinary since I was flying from Toronto to Boston. To get from A to B, I first looked up how long it would take to get to the airport on Google maps. Then I called an Uber, and the driver took me off at the airport. My airline and border security recorded information on me while I was in the airport. I suspect there is a lot of surveillance at the airport, so my guess is that a lot of my data was taken during this period. I took an Uber from the airport in Boston to my house. Additionally, I ate lunch and dinner out and picked up a prescription, which means my credit card company, pharmacy, and the restaurants I went to all have access to my location.

Getting Online
I spent most of the day doing homework, which involved looking up documentation for coding languages. I also sent some emails on Gmail and streamed some music on Spotify.

Other Things
Since I was away from Boston for most of the day, I created data through my absence. For example, I usually use BlueBikes to get around, but I didn’t use them today, which they could use to infer that I was out of town.