by Xio Alvarez, Sarah Mousa, and Devin Zhang
The tropical cyclones database includes granular meteorological data on all cyclones ever recorded by NOAA. While many people have some general familiarity with the categorizations given to cyclones, we precieved a gap between the highly specific data presented in the database and the physical impact of the storms themselves. Most people will understand that a category 5 is stronger than a category 2 cyclone, but the magnitude of difference and what that atmospheric pressure and wind speed actually appears as on the ground are less understood.
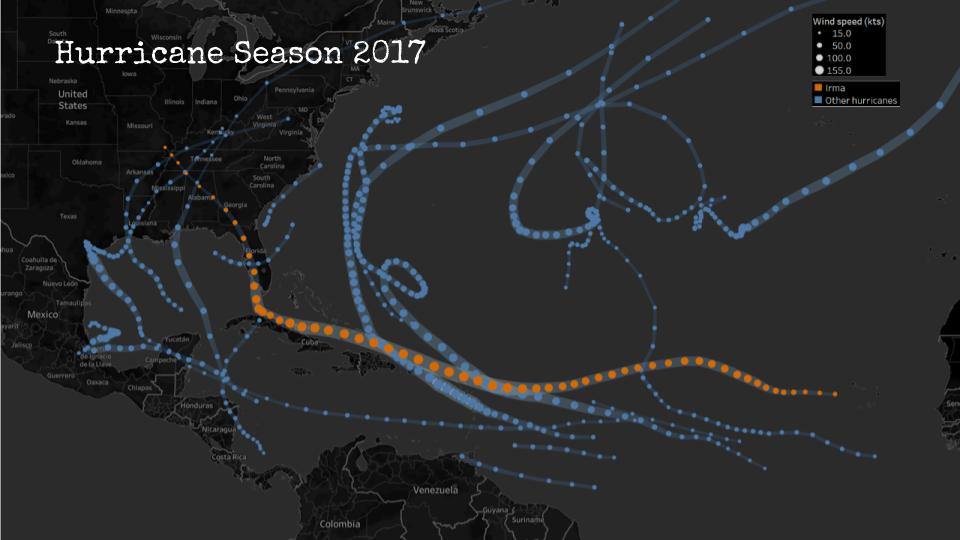
We decided to take this data and develop a sketch for a a tv series called “The Life of a Storm” which would connect the meteorological details of historical cyclones to the images and stories of their impacts on the ground. One thing that was clear from the data was that each storm moves through many phases and is felt differently in different places. Our news research also showed us that similar storms can have different impacts depending on how prepared people are for their arrival. The intention of this series is to educate a general public audience on the impacts of different storms and the types of preparedness and policies that are effective in mitigating their effects.
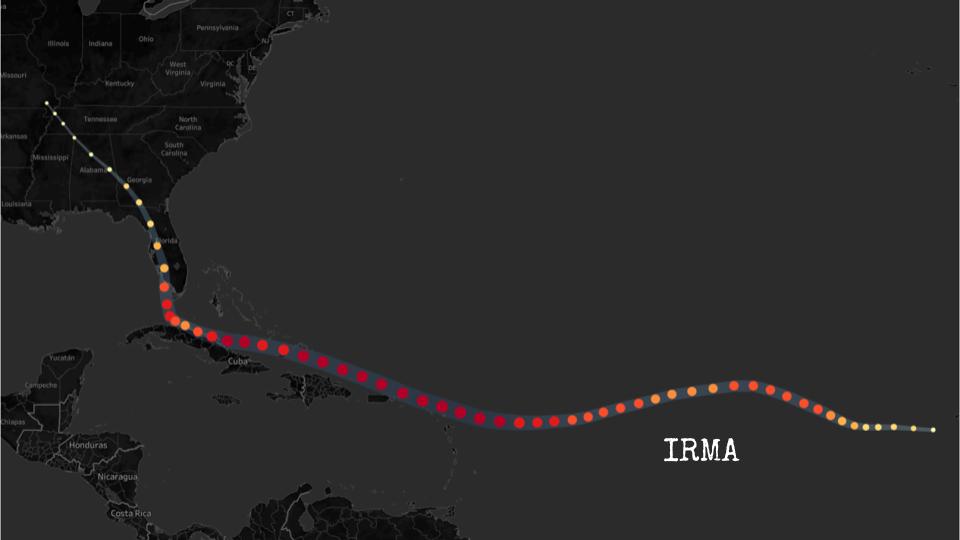
“The Life of A Storm: Hurricane Irma”
Our sketch looks at Hurricane Irma, one of many cyclones from the dataset that struck the Carribean and southern coast of North America in the hurricane season of 2017. Irma is a useful storm for us to use for this premier episode as it began as a category 5 and proceeded to make landfall as it progressed through its decline, tracking across western Florida before downgrading to a tropical storm and then depression over Georgia and Alabama. Our sketch geographically locates the storm as it downgrades, stopping at each point to understand how the effects were felt on the ground and what types of damage were typical in that area. We connect these images to stories from neighbors and victims in their own words.
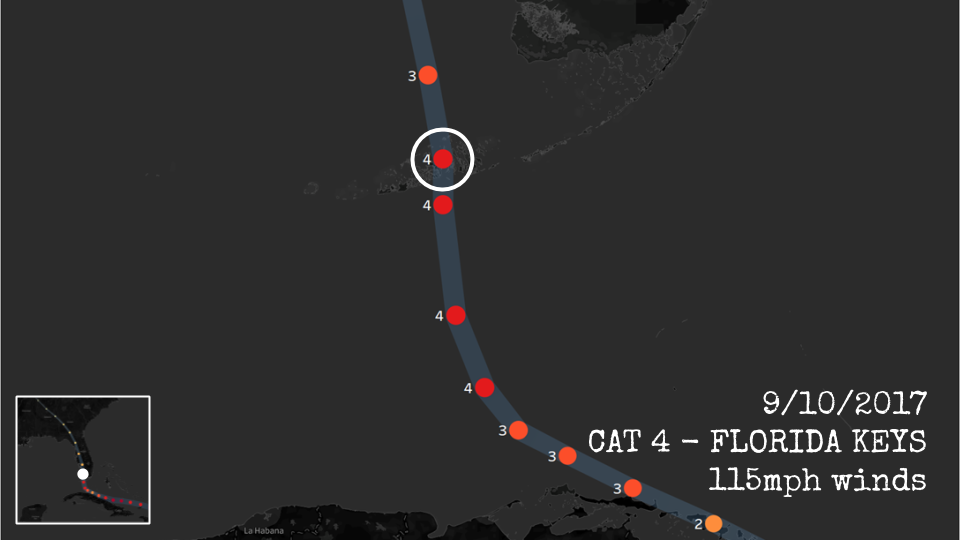
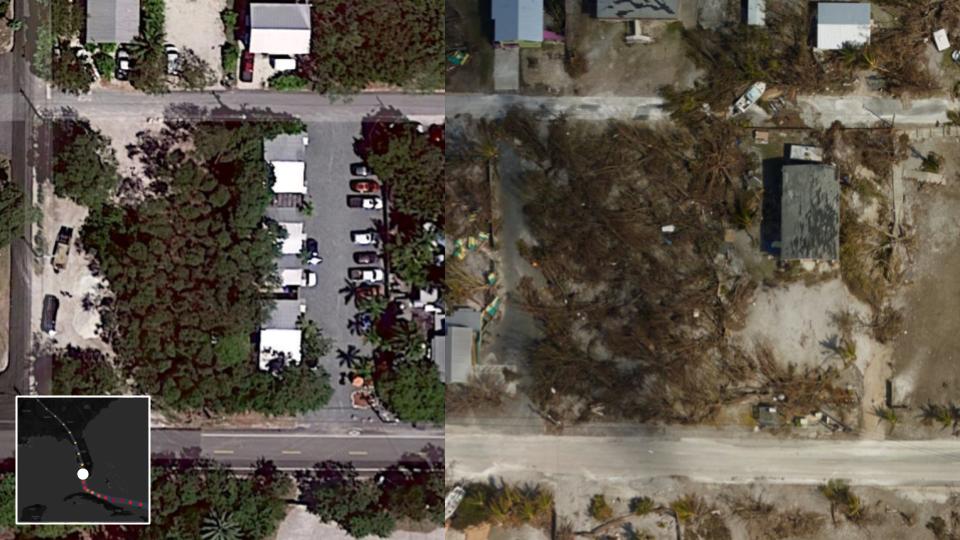
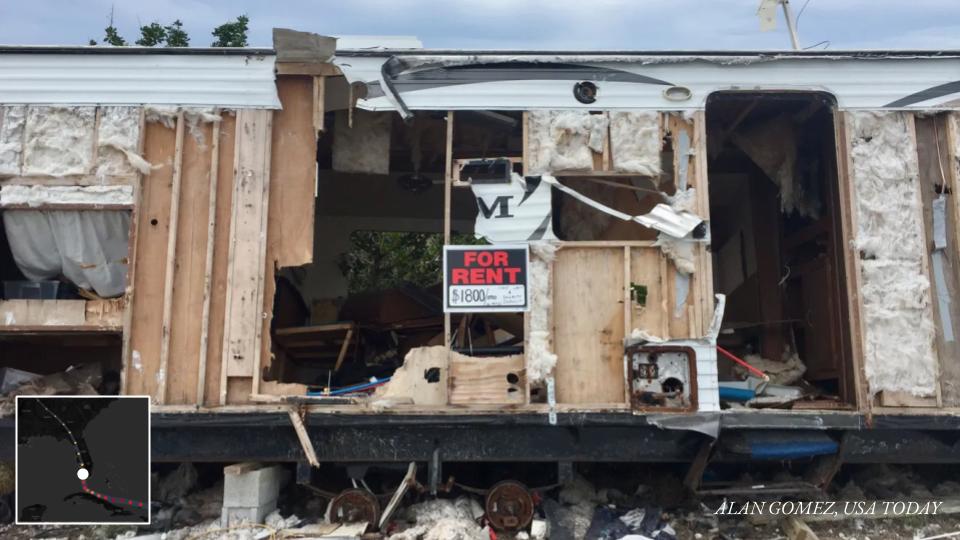
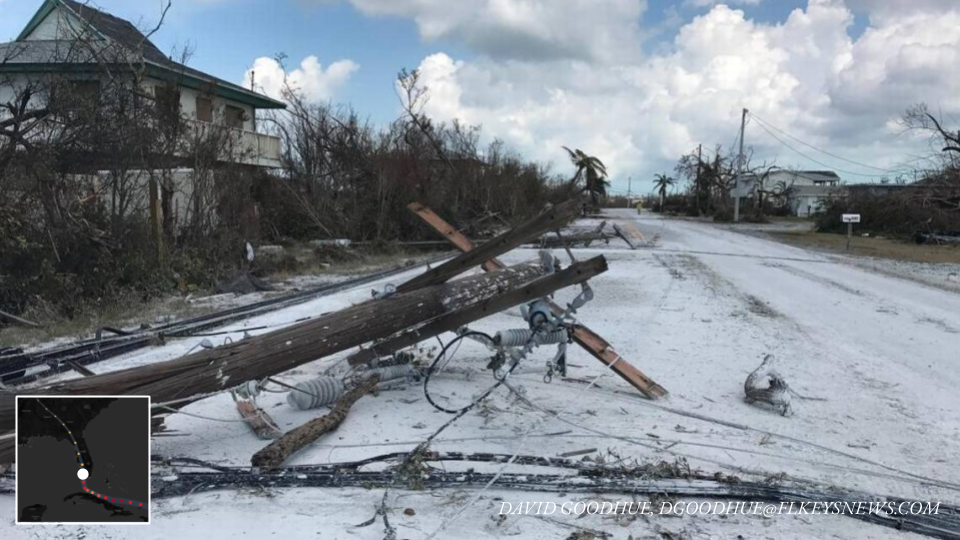
Our hope is that by traversing levels of abstraction (maps to satellites to photos), we are able to create a memorable connection between the technical language of emergency management and meteorology.
Other Sources
Satellite Images: Google Earth
News reporting:
Cuba:
- https://www.miamiherald.com/news/nation-world/world/americas/cuba/article194517349.html
- https://www.usatoday.com/story/news/world/2017/09/10/cuba-sees-devastation-hurricane-irma/651125001/
Florida:
- https://www.sun-sentinel.com/news/weather/hurricane/fl-reg-keys-visual-then-now-20180907-story.html
- https://www.miamiherald.com/news/weather/hurricane/article172742816.html
- https://www.miamiherald.com/news/local/community/florida-keys/article217950495.html
- https://www.orlandosentinel.com/weather/hurricane/os-hurricane-irma-damage-in-naples-and-southwest-florida-pictures-20170912-photogallery.html
- https://www.washingtonpost.com/national/health-science/tampa-bays-escape-from-irma-was-more-than-luck-some-say/2017/09/15/5f7b618e-9a20-11e7-87fc-c3f7ee4035c9_story.html
Georgia:
- https://wgxa.tv/news/local/photos-hurricane-irma-damage-across-middle-georgia
- https://www.weather.gov/ffc/2017_Irma#winddamagephoto
