by Cynthia Hua
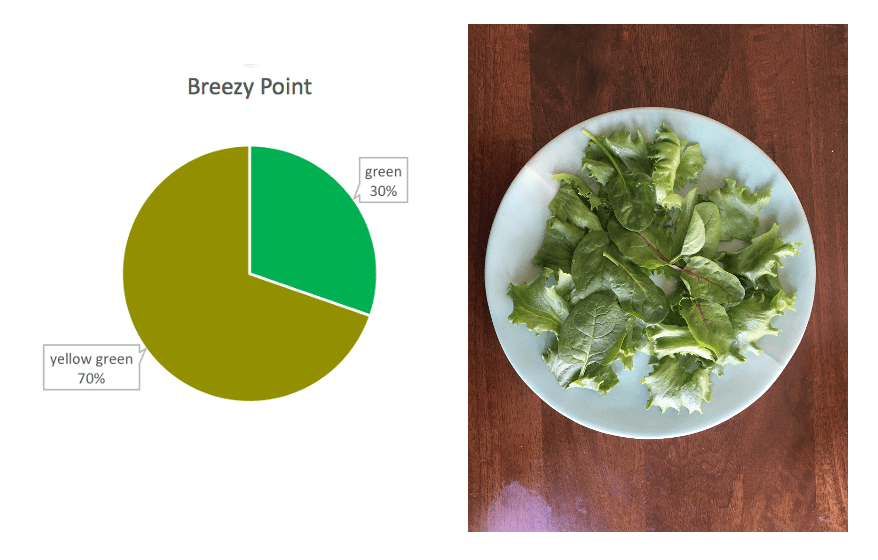
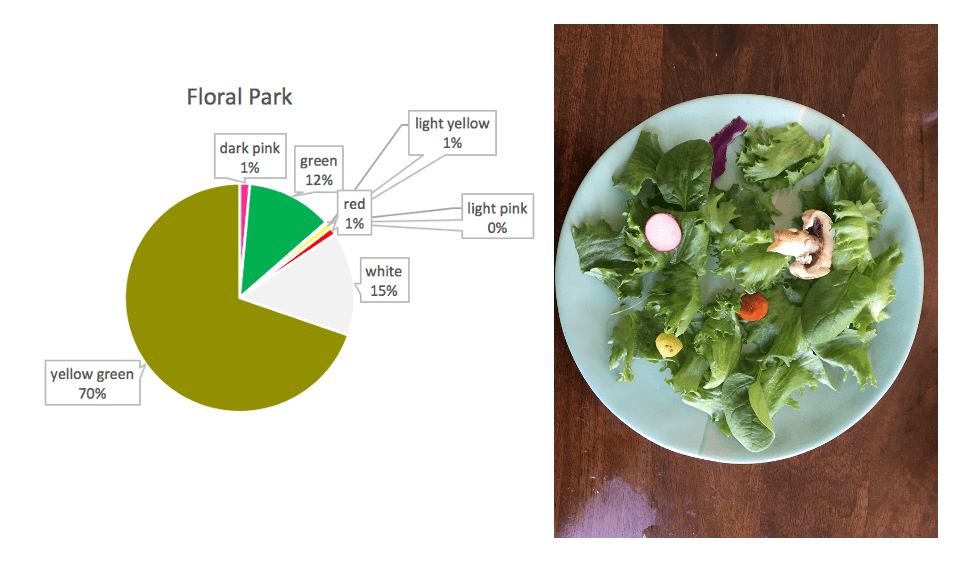
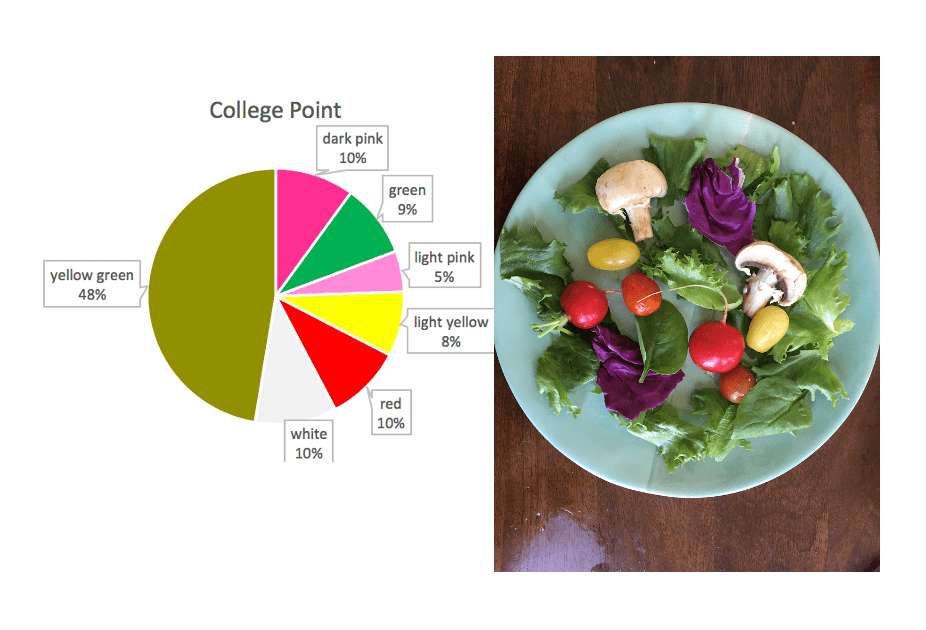
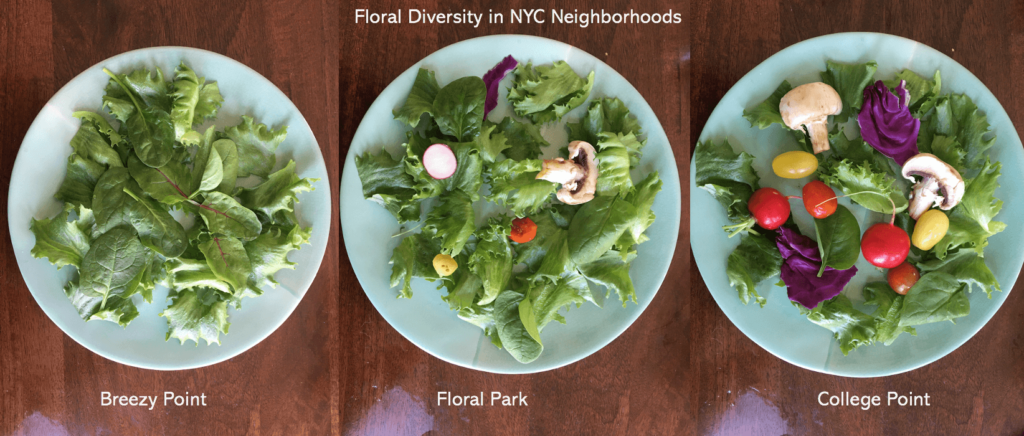
These salads are a data sculpture represent the diversity of flower blooms in NYC. The diversity of vegetables in each salad represents the diversity of flowers in the dataset, with the amount of each corresponding to the proportion of each flower.
DATA
The original dataset (link here) was 2015 data from the NYC Tree Census from the NYC Parks Department. https://datastudio2020.datatherapy.org/2020/03/05/the-city-in-bloom/ The data gave various types of trees producing flowers of different colors across different seasons.
AUDIENCE
I thought about targeting a local community meeting where neighborhood tree and flower planting would be discussed. I positioned myself as a non-profit or city department educating and advocating for greater plant diversity within NYC neighborhoods. Therefore, I wanted a conceptually simple data sculpture that was interactive and could spark discussion.
I decided to create a salad with the idea that it would double as food for a town meeting and an ice breaking discussion topic. Some attendees could be served the less colorful salad and others the more colorful one, and it could be revealed once the meeting started that these were data sculptures. It could help ease attendees into the meeting subject while making data more digestible.
CONCEPT
I created three salads representing three neighborhoods in NYC with noticeably differing flower diversities.
The idea of using leaves and other plants in a salad is meant to continue the narrative of natural diversity in this story. Also, it reinforces the idea that the best salads have a diverse mix of plants.
I mapped vegetable type onto flower color:
- Dark Pink — Purple Cabbage
- Light Pink — Radish
- Red — Red Cherry Tomato
- Light Yellow — Yellow Cherry Tomato
- Yellow Green — Romaine Lettuce)
- Green — Spinach
- White — Mushroom
The resulting sculpture emphasizes the importance of fostering diverse neighborhood ecologies — with the idea that the colorful salad is most appealing to look at just like how a more ecologically colorful neighborhood is beautiful to live in (though I realize both are somewhat subjective).
CHARTS


REFLECTIONS
Making a data sculpture was a fun exercise. In doing this sculpture, I felt limited on resources and data. I would have liked to have more detailed data and used that to make larger, more colorful salads. I think having a bigger plate would have had more aesthetic impact. I was also not sure about how I arranged the salad — I mixed the vegetables but I also considered a pie chart formation on the plate.
