Fernanda Ferreira

Summary
For my dataset I chose the “Freedom of Information Act Annual Reports 1975-2018” set compiled by A. Jay Marquette, a journalism and media studies professor at Marquette University. The dataset collects the number of received, processed and denied/granted (plus a lot of other details) FOIA requests sent to federal departments. I chose the data set because I filed a FOIA in December and have been curious about the process ever since.
FOIAs, which give the public the right to request access to federal documents, memos and internal communication, are essential in keeping the government open and accountable. Investigative journalists, for instance, use FOIA requests to gather information and uncover wrongdoing. But the Freedom of Information Act, signed in 1967, only grants access to make a request; it doesn’t guarantee that you’ll get the documents you’re looking for.
The “FOIA Annual Reports” dataset demonstrated two trend: a steady increase in the number of FOIA requests filed and, for certain departments, an increase in the number of partial grants and full denials of requests. I focused the sketch on the Department of Homeland Security because of the number of FOIA requests sent to the DHS, the drop in full grants given, and, lastly, the large number of issues that fall under the DHS purview (terrorism, immigration, pipelines, etc). The DHS was established post-9/11 and there is information on FOIA requests from 2003 to 2018.
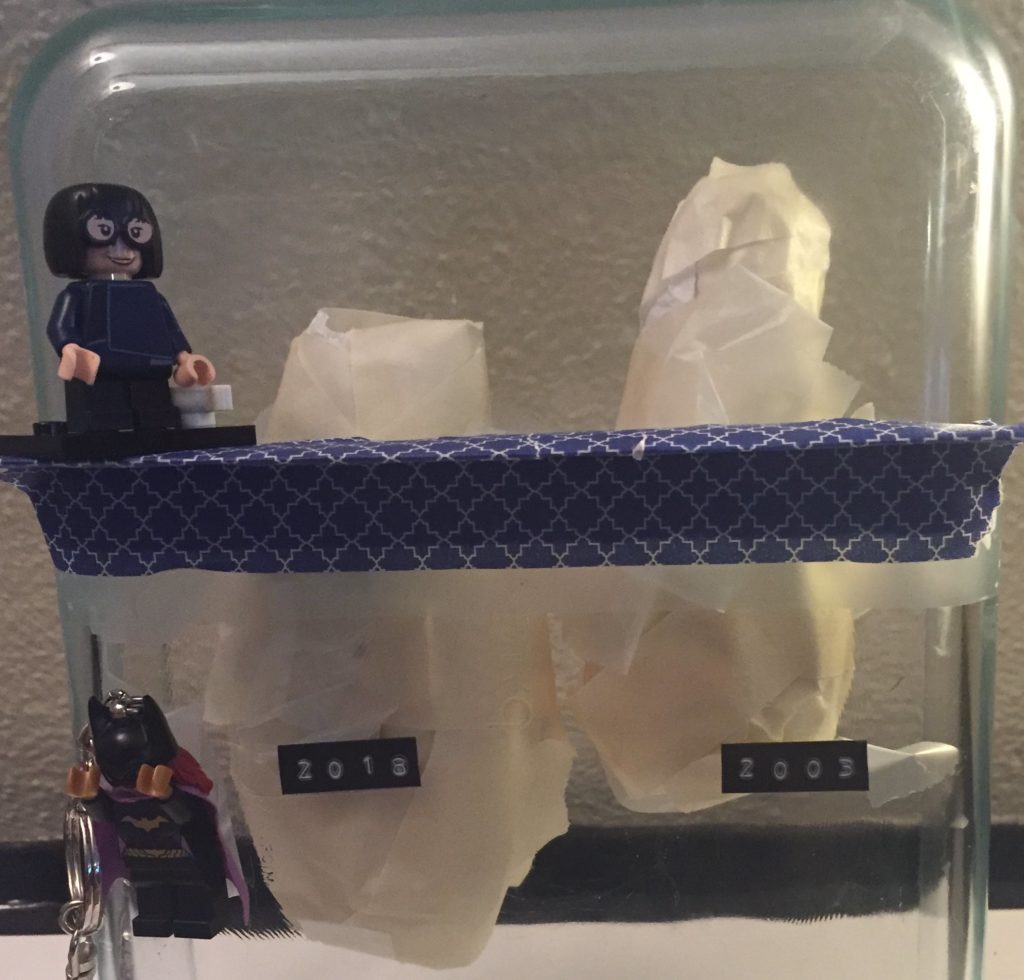
The sculpture is a two-story glass aquarium with 16 “icebergs” (one for each year of FOIA requests and they are made out of paper to represent government documents) in a contemporary art museum. Visitors enter on the second floor and see just the tip of the iceberg, which represents FOIA requests granted in full (a layer of opaque blue limits their view of the underside). Visitors then descend to the first floor, where they get an underwater view of the icebergs, showing the vast underbelly of FOIA requests that are denied in full or only partially granted. As the years pass, the size of the underside of the iceberg increases.
This sculpture plays on the imagery of an iceberg and the overused “tip of the iceberg” phrase to show the increasing number of denied FOIAs and asks the museum’s visitors to remember that each denied FOIA is a story that is being hidden from the American public.
Sketch

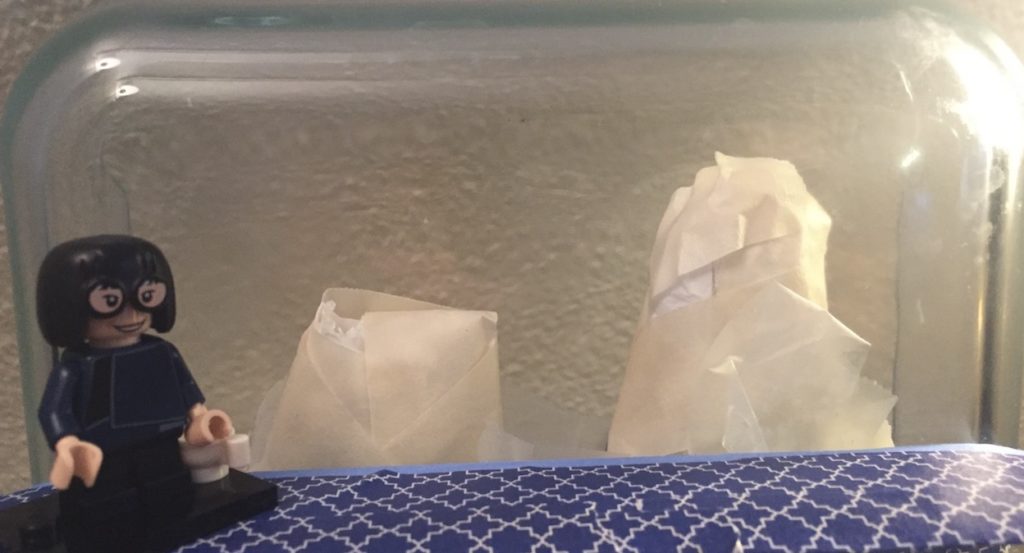
The sketch is (obviously) a very paired down version of the sculpture using a Pyrex casserole dish to represent the aquarium, two icebergs (2003 and 2018) made of tissue paper and tape, and two Lego figurines (Batgirl and Edna Mode) to represent visitors at the museum.
It’s hard to see in the image, but the icebergs have different sizes since there were 160,902 requests in 2003 and 374,945 in 2018. Shown above the water (denoted here as the blue platform on which Edna stands) are the total “granted” requests (40% in 2003 and 6.9% in 2018), while below is every FOIA that was completely denied or only partially granted.
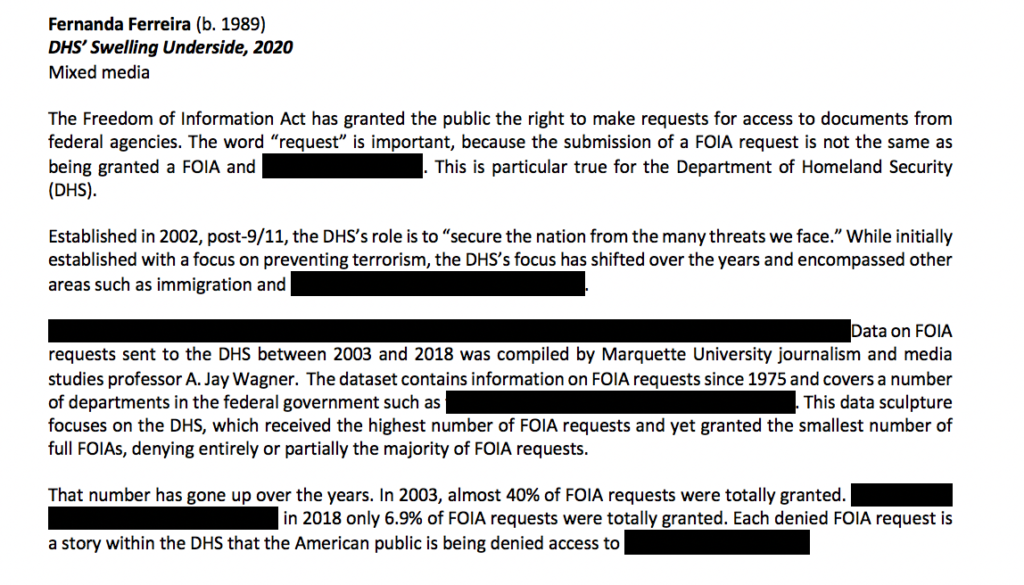
I think we all recognize the image of blacked-out government documents. To keep with the theme of information that is withheld, descriptions about the data of the sculpture will also be displayed with partially blacked out sentences and words.

In putting the sketch together, I quickly noticed how hard it is to include more information into a data sculpture, both for aesthetic and comprehension purposes. For instance, the government has a number of exceptions it can evoke to deny a request. I tried to include that information by creating different bands on color on the iceberg underside, but it looked silly and was hard to comprehend.
References
Wagner, A.Jay, “[Data] Freedom of Information Act Annual Reports 1975-2019” (2020). College of Communication Research Data. 1.
https://epublications.marquette.edu/comm_data/1