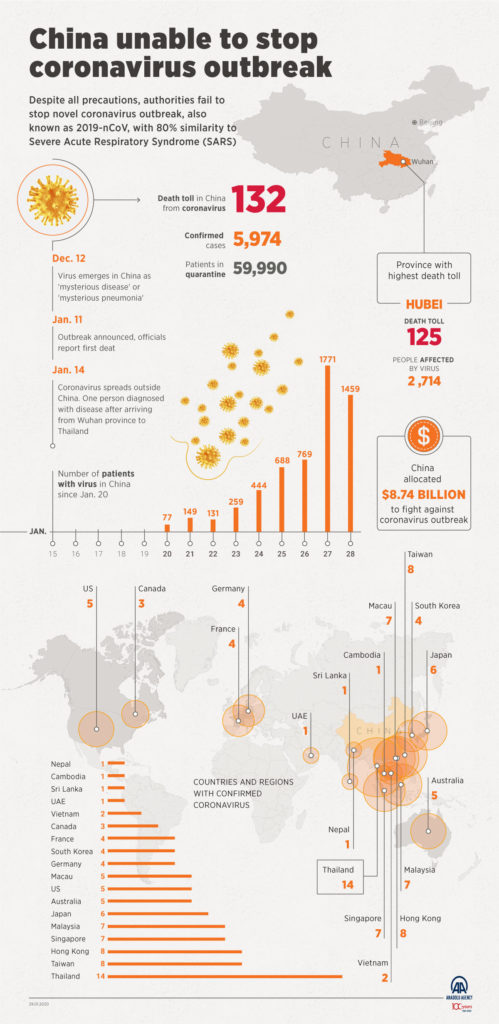
This infographic displays numerical and geographical data about the 2019-nCov virus. It uses a warm color palette and mostly numerical data to show how many people have been infected, how much money was allocated by China to fight against the outbreak, and how much the virus has spread around the world. It also calls out the death toll of the disease, shows a timeline of the disease’s progression, and shows the magnitude of its presence in other countries.
To me, it looks like one main goal of the infographic is to convince the reader that Coronavirus cannot be controlled (the infographic headline is “China unable to stop coronavirus outbreak”). Overall, the infographic is effective in doing this by showing qualitative data about the spread and the progression of the virus over time. However, the infographic could do a better job describing what precautions China tried to take, as it has a narrative that despite great effiorts, the government wasn’t able to stop the spread of the virus (“Despite all precautions, authorities fail to stop novel coronavirus outbreak…”). The infographic never describes what these precautions were, and only provides a numerical value of how much money ($8.74 billion) has been allocated to fighting the disease.
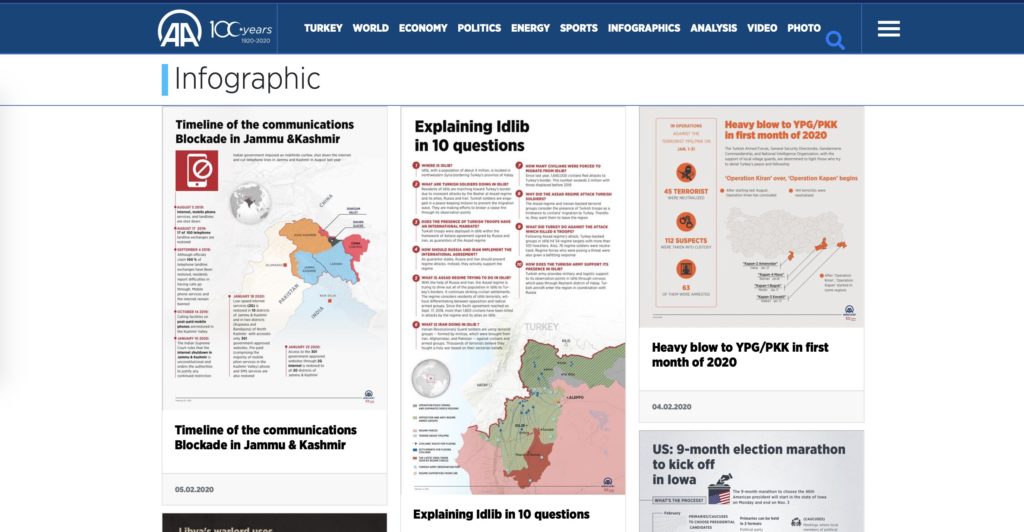
Because this was published on the Andolu Agency website, a Turkish state-run news site, the infographic seems to be directed to civilians. One interesting thing I noticed about the Andolu Agency website is that it has an entire section dedicated to just infographics. I am curious about who browses the infographics on this website versus who browses the traditional news stories.