https://www.wsj.com/graphics/new-space-race/
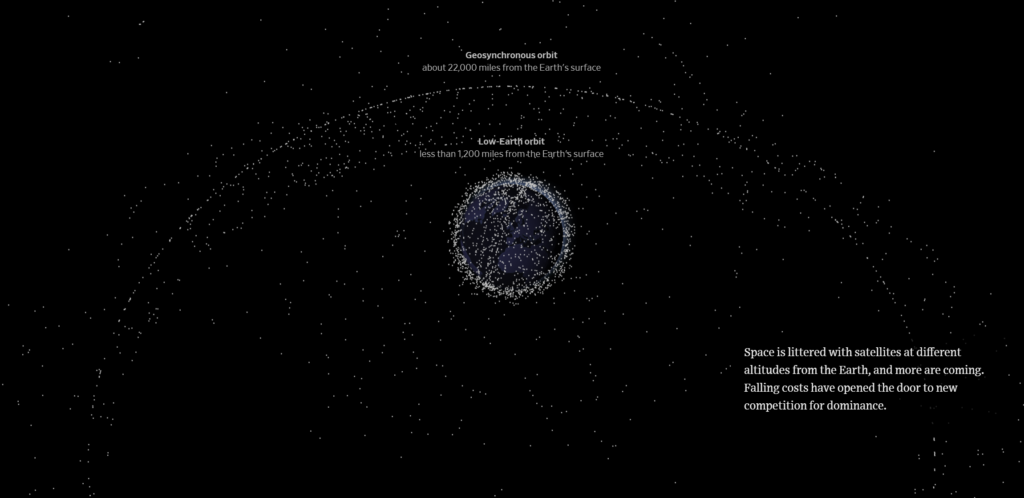
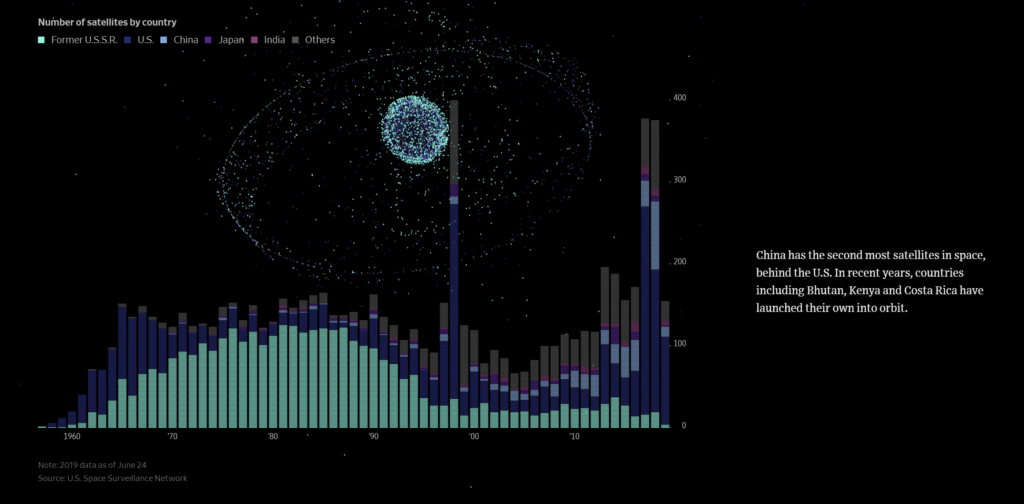
This scrolling data story shows a dataset on satellites orbiting the Earth, with the goal of highlighting the magnitude of the business opportunity and impact of recent space exploration developments. The main dataset is from the U.S. Space Surveillance Network, which contains details about each satellite orbiting the Earth, including the country of origin, purpose, and type (government/commercial). The data is visualized in both charts and in a model of Earth with its surrounding space.
The data is augmented by details on possible business opportunities, including satellite-based internet services such as SpaceX’s Starlink…

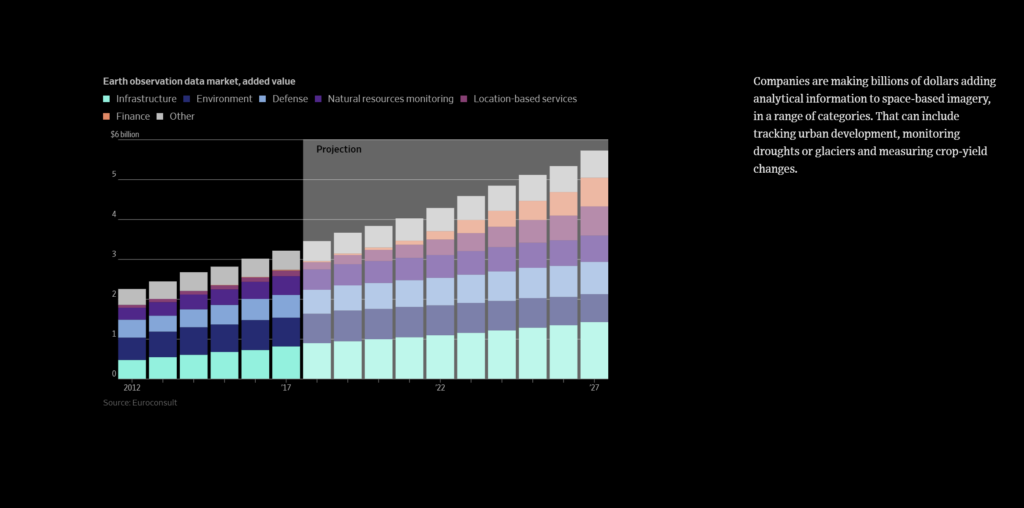
… as well as satellite imagery services, which is forecasted to be a growing industry in the coming years.
The purpose of the article is to inform the Wall Street Journal’s typical audience, largely business and finance-focused professionals, of the economic and business implications of current trends in space exploration and satellite launches. It also tries to educate the audience about some basics of orbital satellites, including the key government/commercial players, satellite and orbital types, and the risk of space debris.
The story’s bar charts and simple data visualizations very effectively show some of the key trends relevant to the industry: the shift from government to commercial, the rise of China as a significant player, the decreasing cost of launching payloads, and the increasing economic opportunity in satellite imagery. The visualization of satellite clouds in orbit is also an impactful one, emphasizing the magnitude and scale of the topic. While some orbits and satellite densities are exaggerated compared to actual sizes, the visualization serves its purpose well.
The story also does an effective job of visualizing the business opportunities of two specific companies, SpaceX and Planet Labs. However, from a storytelling perspective, it does not transition into these two cases very effectively. A visual demonstrating the presumed dominance of these two players in their respective industries may have better justified their inclusion.