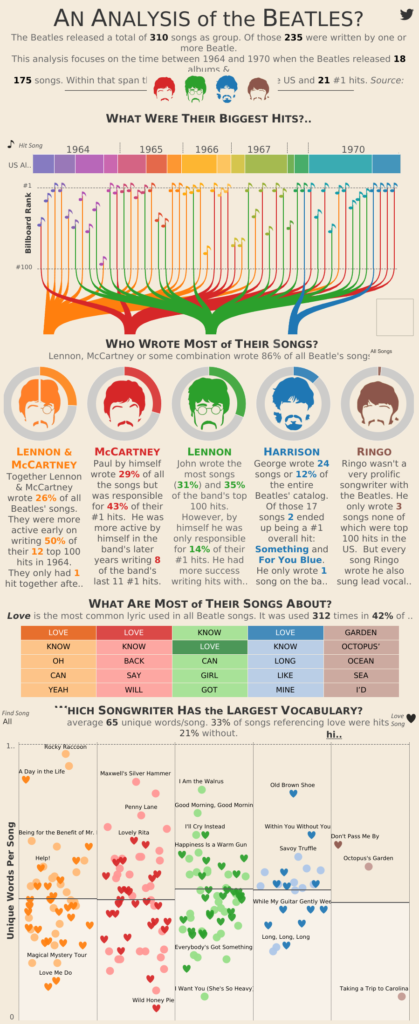
Recently, I have stumbled upon this great infographic analyzing the individual contribution of each of The Beatles members. It uses creative ways to communicate information in a clean and aesthetic fashion.
In the first graph, the author succeeds in explaining in an easy-to-understand presentation of the different songs that each member wrote with a few details about each song. The author uses a combination of (1) An silhouette of the author to identify him, (2) A color of the line to assign each song to its creator, (3) Location on the horizontal axis to represent year, (4) Location on the vertical axis to represent billboard rank, and (5) A color of the note to (also) represent the year. Five clear pieces on a single graph. The only thing that I would change in order to improve this format is to color the note (5) in the same color of the line, as coloring it according to the year doesn’t add any information and only causing confusion.
The third part, about the most common words, is a little stale to my taste. Beyond the notion that Love is the most common word, it’s hard to get any interesting insights from it.
The ending part is again clear and creative. I loved the heart sign to represent love songs, and it is easy to get a notion of the distribution for different members. The only improvement that I could suggest for this part is explaining the meaning of the horizontal line in the middle of each box, which, I can only guess, means average.